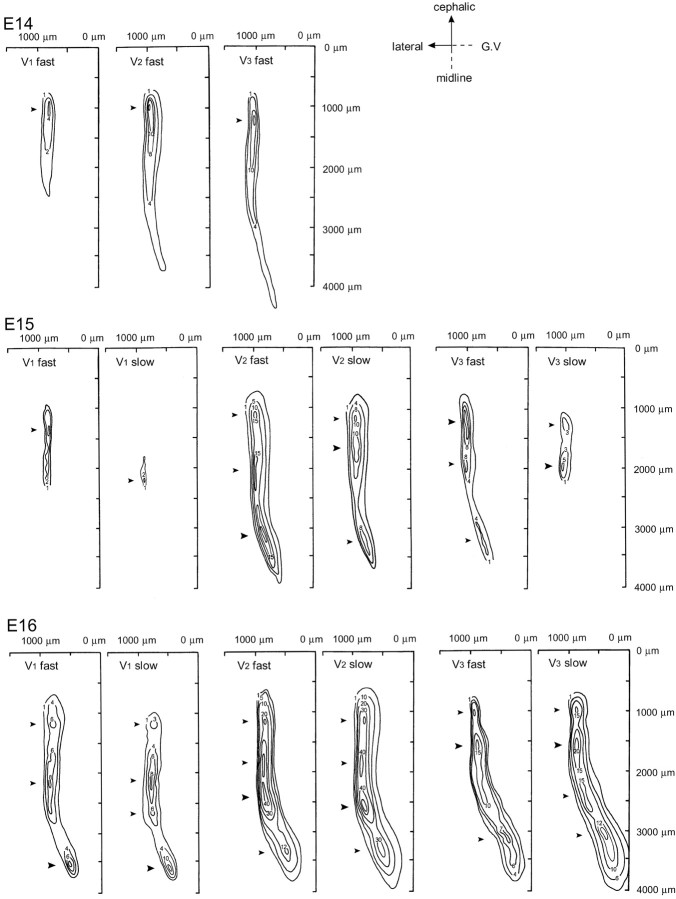
Figure 8.
Contour line maps of V1-V3 responses. Spatial distribution patterns of the optical signals detected from E14 (top), E15 (middle), and E16 (bottom) preparations are shown. The numerals on the contour line indicate the fractional changes multiplied by 10 4. The y-axes correspond to the midline of the preparation, and the x-axes correspond to the level of the trigeminal ganglion. The root of the trigeminal nerve is positioned caudal to the x-axes. Arrowheads indicate peak locations. The large arrowheads show the largest peaks.

