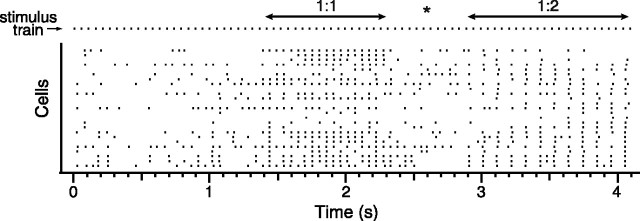
Figure 8.
CS responses switch between entrainment patterns during MCtx stimulation. Raster display of CS activity during one 4 sec, 20 Hz MCtx stimulus train. Each row represents the CSs from a single Purkinje cell. Stimulus times are shown in top row (stimulus train). During this train, there was one period each of 1:1 and 1:2 entrainment, as indicated on the figure. Asterisk indicates transition period between 1:1 and 1:2 entrainment.

