
Figure 8.
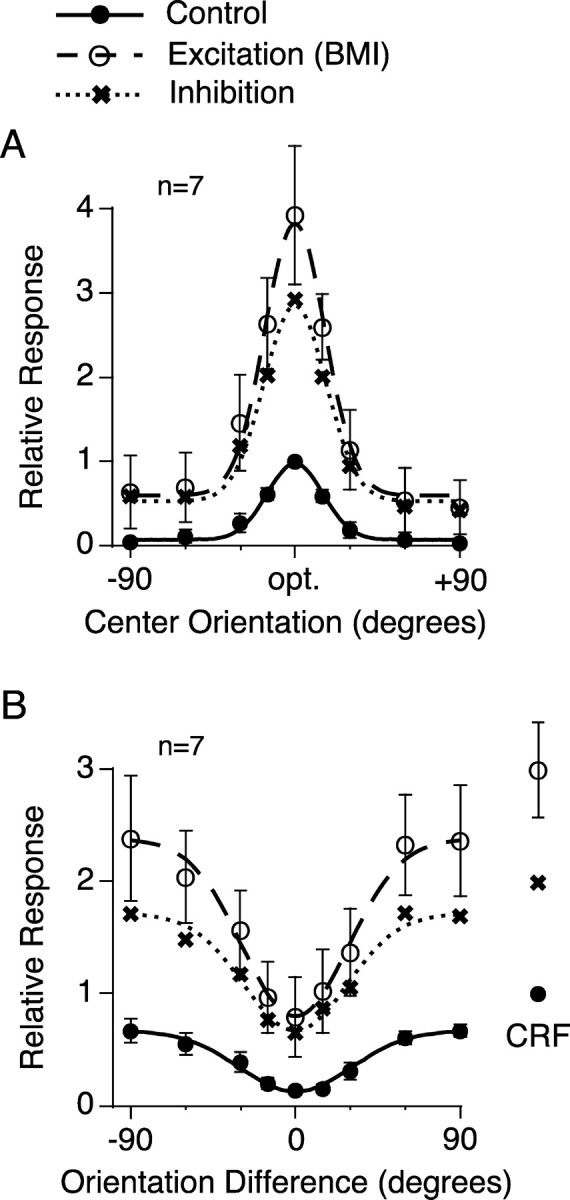
Relationship between excitation and inhibition to the orientation tuning of the CRF response and the surround suppression. A, B, Orientation tuning curves were normalized and averaged for the responses to the CRF grating (A) and the surround effect (B). The curves of inhibition were obtained by subtracting the control response from the response with BMI administration. Data in A and B are fitted by Equations 4 and 3. Error bars indicate ±1 SEM. During BMI administration, the responses to the CRF grating with the optimal orientation and size were 393 ± 82% (mean ± SEM; n = 7) of the control response in A and 299 ± 42% in B.