
Figure 7.
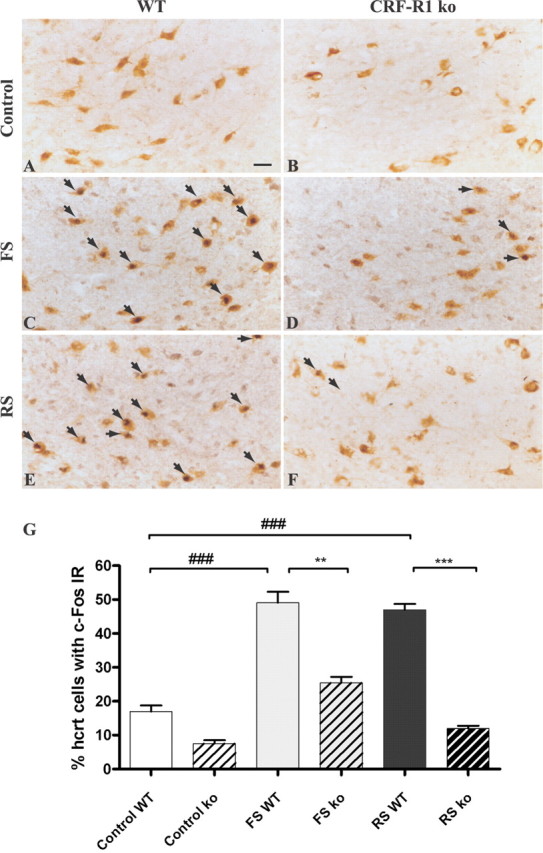
Activation of hypocretin neurons during footshock and restraint stress in CRF receptor 1 knock-out versus control animals. A-F, Representative tissue sections at the level of the perifornical area of the dorsolateral hypothalamus illustrating hypocretin (brown DAB staining) and c-Fos (dark blue DAB-NiCl2) immunoreactivities for control groups (A, B) and stressed groups (C-F). Double-labeled neurons are shown by arrows. Scale bar (in A), A-F, 10 μm. E, Percentage of hypocretinergic neurons immunoreactive for c-Fos in CRF-R1 knock-out (ko) versus wild-type (WT) mice during footshock (FS) or restraint stress (RS) challenge. Data are expressed as mean ± SEM. **p < 0.001; ***,# # #p < 0.0001. n.s., Not significant.