Figure 5.
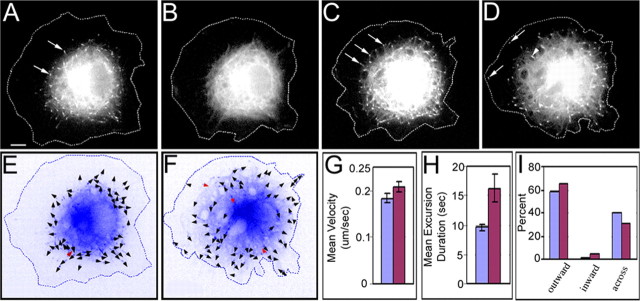
Live-cell visualization with GFP-EB3 of microtubule behaviors in neurons depleted of actin filaments before axon formation. A-D are still images extracted from a time-lapse movie of a single GFP-EB3-expressing neuronal cell body with a large lamellar region. See movie 1 (available at www.jneurosci.org as supplemental material). Arrows in A, C, and D denote GFP-EB3 comets. Before depletion of filamentous actin, microtubules were mostly constrained to the central region of the cell body, presumably attributable to the actin-rich lamellae found in the periphery (A). At the time of drug addition to the culture, the GFP-EB3 appeared to temporarily dissociate from the plus ends of the microtubules (B). After actin filaments were depleted, plus ends of microtubules were seen to invade more peripheral regions of the neuron (C, D). Before drug treatment, ∼60% of the excursions occurred from the cell center outward to the cell periphery, whereas most of the others occurred across the cell (E, I). After drug treatment, there was an increase in these outward excursions as well as a small increase in inward excursions and a corresponding diminution in excursions going across the cell (F, I). Arrowheads in E and F indicate the direction of GFP-EB3 excursions, and red indicates inward directionality. There was also a small increase in the velocity and a greater increase in the duration of GFP-EB3 excursions after actin depletion (G, H). Blue bars indicate control data, and red bars indicate experimental (actin-depleted) data in G-I. Scale bar, 5 μm.

