Figure 6.
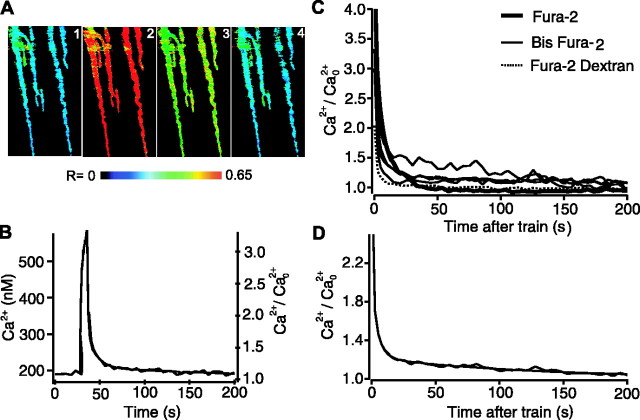
An augmentation-like component of decay of residual Ca2+ after conditioning trains with 2 mm Ca2+. A, Pseudocolor images of fura-2-loaded terminals before the conditioning train (1), just before the last impulse of the conditioning train (2), and 1.75 and 186 sec after the end of the conditioning train (3, 4). B, Residual Ca2+ measured from nerve terminals from a single preparation loaded with bis-fura-2 before, during, and after a conditioning stimulation (240 impulses at 20 per second). The response is the average from six consecutive trains from a single preparation. Normalized residual Ca2+ is shown on the right axis and was described with the sum of three exponentials starting 1 sec after the end of the conditioning train (smooth line), with time constants of 1.1 ± 1.1, 9.5 ± 4.0, and 260 ± 160 sec and magnitudes of 0.54 ± 0.25, 0.55 ± 0.20, and 0.21 ± 0.05, respectively. C, The decay of residual Ca2+ from six different preparations, measured with bis-fura-2, fura-2, or fura-2-dextran. D, The decay of Ca2+ averaged from the data in D is described by the sum of three exponentials (smooth line), with time constants of 1.8 ± 0.2, 7.8 ± 2.6, and 128 ± 15 sec and magnitudes of 1.7 ± 0.2, 0.28 ± 0.18, and 0.21 ± 0.01, respectively.

