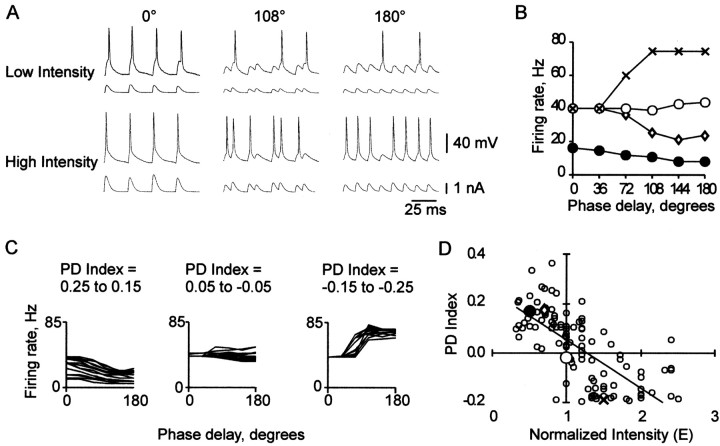
Figure 2.
CD at different levels of input intensity. A, Input current and voltage response at three phase delays (0°, 108°, and 180°), at low and high input intensity. B, Firing rate versus phase delay at four levels of normalized input intensity (E = 0.5, filled circles; 0.7, diamonds; 1.0, open circles; and 1.5, X symbols) in a different neuron. C, Overlaid PD functions for three ranges of PD index: left, 0.25-0.15 (0.187 ± 0.007; mean ± SEM; n = 16); center, 0.05 to -0.05 (0.003 ± 0.007; n = 20); right, -0.15 to -0.25 (-0.165 ± 0.004; n = 15). D, PD index versus input intensity for the four PD functions shown in B (large symbols) and for PD functions from 51 other neurons (small open circles); points off scale: E versus PD index: 0.46 versus 0.76, 3.6 versus -0.19, 4.0 versus -0.14, 4.8 versus -0.21. The trend line (linear fit) in this and all subsequent PD index versus input intensity plots was added for clarity.

