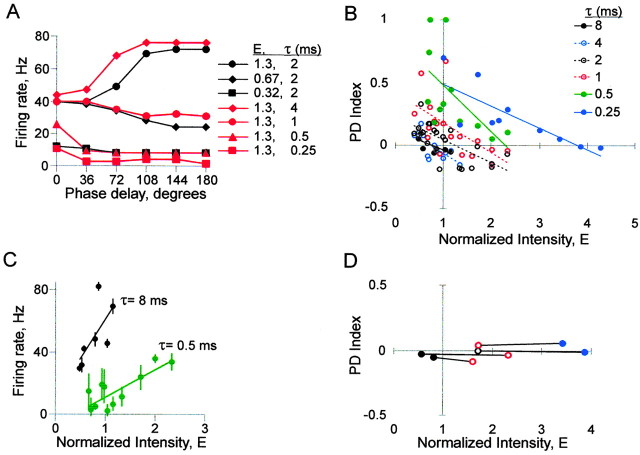
Figure 3.
The effects of synaptic time course (τsyn) on CD. A, Firing rate versus phase delay comparing the control value of τsyn at three input intensities (2 msec, black symbols) with different values of τsyn at one input intensity (red symbols). B, PD index versus input intensity at different values of τsyn; n = 12 neurons. C, Average firing rate versus input intensity for all PD functions at two values of τsyn; n = 12 neurons. Each data point represents the average of firing rates at all six phase delays for one PD function; error bars show SD. D, Four examples in which both the slope and Y-intercept of the PD function were maintained by shortening τsyn as intensity was increased. For the two PD functions within a neuron (connected by lines), both PD index and firing rate (average of all 6 phase delays) differed by <10%. The symbols for τsyn are the same as in B.

