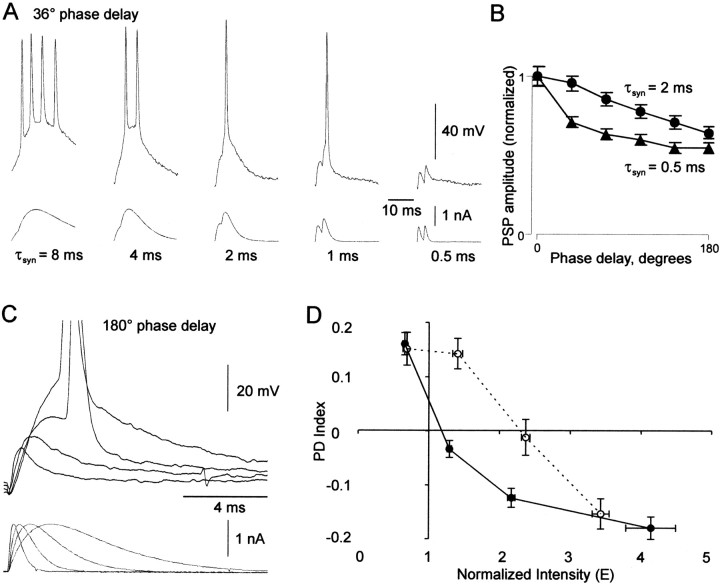
Figure 4.
Properties mediating the effects of τsyn. A, Traces of current injection and membrane voltage response in one neuron at 36° phase delay with five different values of τsyn. B, Plots of peak PSP amplitude (mean ± SE) versus phase delay in six neurons with τsyn = 0.5 msec (triangles) and 2 msec (circles). Each phase delay is the average peak amplitude of all subthreshold PSPs in one train per neuron. Peak amplitude was measured from baseline at the start of the stimulus cycle. Averages were then normalized to the peak amplitude of the 0° phase delay. C, Overlaid current and voltage responses in one neuron at 180° phase delay on the first stimulus cycle with the same peak current, with four different values of τsyn (0.25, 0.5, 1, and 2 msec). D, PD index versus input intensity in current-clamp mode (black line) and dynamic clamp mode (dotted line). Each data point represents PD index (mean ± SE) versus E (mean ± SE) for a group of data points (the current-clamp plot was calculated from the data set in Fig. 2D). The E values for the dynamic clamp data were normalized for comparison with current-clamp data as follows. For Equation 4 (E = kNp/T), k was calculated as g(Vm - Vr), where g is the unitary peak conductance used for dynamic clamp, Vm is the resting potential of the cell, and Vr is the reversal potential (always set at 0 mV) of the simulated synaptic conductance.

