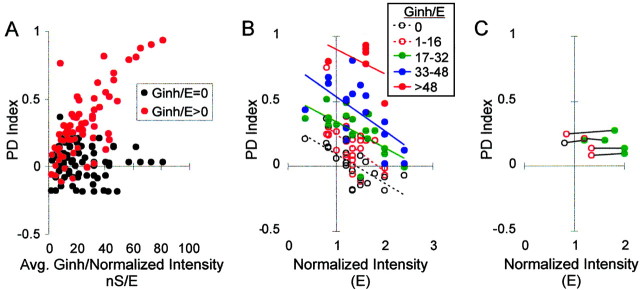
Figure 6.
Effect of increasing Ginh/E on a population of neurons. A, PD index versus Ginh/E in 15 neurons. B, PD index versus input intensity at different values of Ginh; n = 15 neurons. C, Five examples in which both the slope and Y-intercept of the PD function were maintained in a neuron by upward scaling of Ginh/E with intensity. For the two PD functions within a neuron (connected by lines), both the PD index and firing rate (average of all 6 phase delays) differed by <10%. The symbols for Ginh/E are the same as in Figure 6B.

