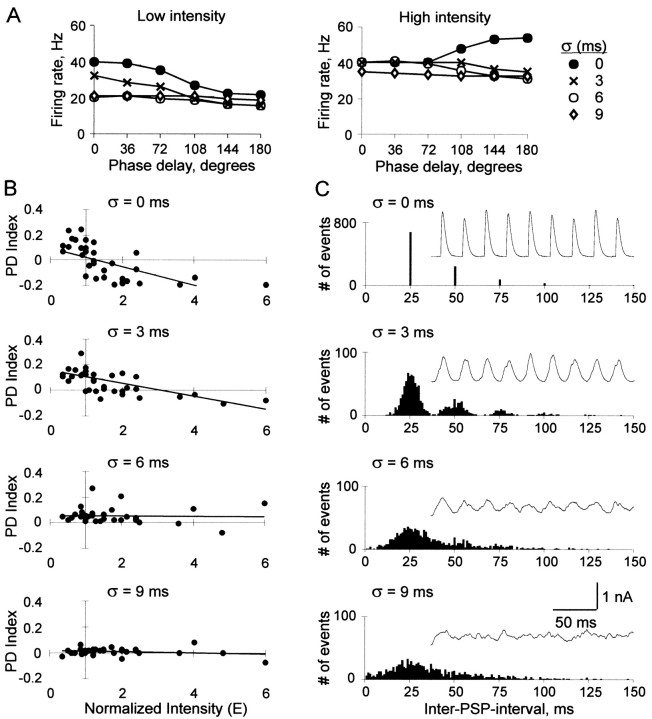
Figure 8.
Effects of input jitter. A, Firing rate versus phase delay with σ = 0, 3, 6, and 9 msec of jitter, at low input intensity (E = 1, left) and high input intensity (E = 2, right). B, PD index versus input intensity at each jitter level (σ = 0, 3, 6, and 9 msec; top to bottom) in 12 neurons. C, Examples of input current (insets) and corresponding interspike interval histogram for each jitter level (σ = 0, 3, 6, and 9 msec; top to bottom).

