
Figure 8.
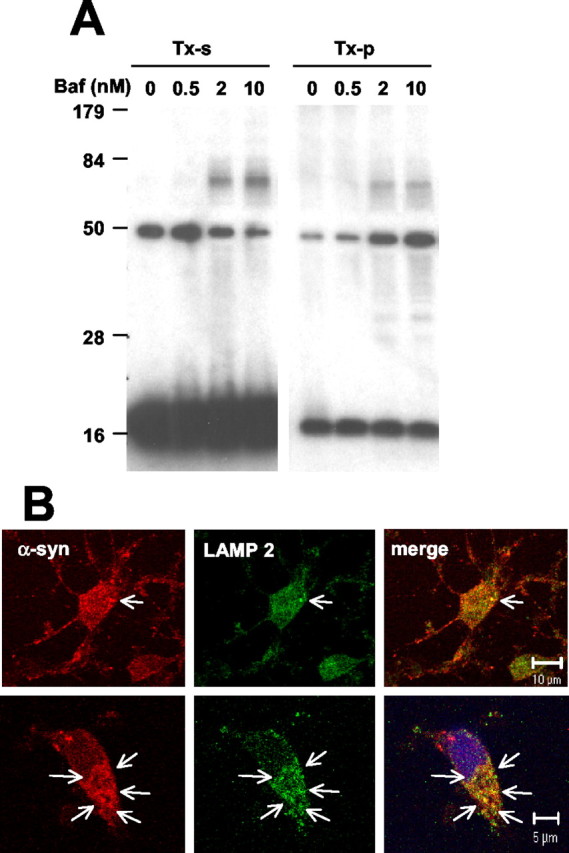
Accumulation of α-syn oligomers in rat cortical neurons. A, Neurons (DIV 11) were treated with Baf at the indicated concentrations for 24 hr. Endogenous α-syn in the Triton-soluble (TX-s) and Triton-insoluble (TX-p) fractions was analyzed by Western blotting. B, DIV 11 cortical neurons were treated with the mixture of serine, cysteine, and aspartic protease inhibitors for 2 hr (top images) and 4 hr (bottom images) and fluorescently labeled for α-syn (red) and LAMP 2 (green). Arrows indicate the colocalization between α-syn and LAMP 2. Nuclei were stained with Hoechst 33258 (blue).