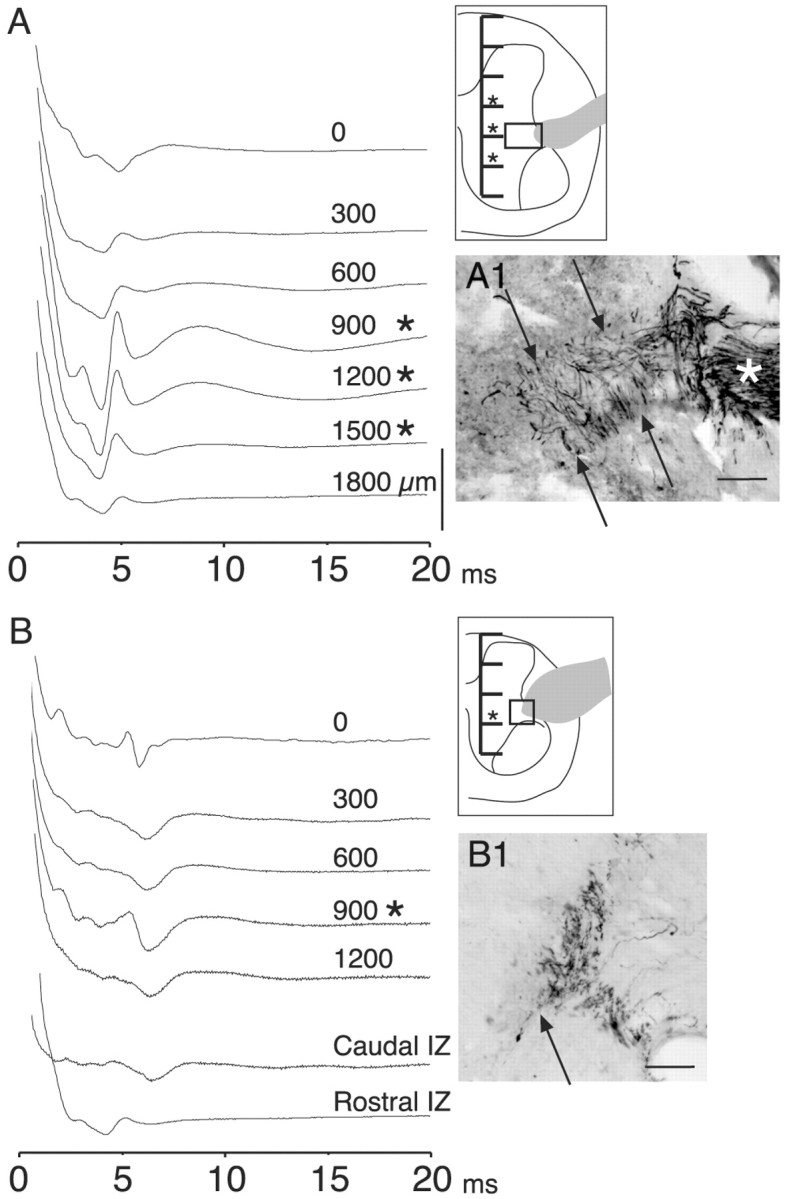
Figure 7.

T13 nerve stimulation evoked short-latency potentials from the intermediate zone and ventral horn. A, Experiment during which recordings (ensemble averages, 10 stimuli each) were made from the surface (just beneath the pia) of the cord and at 300 μm intervals (see inset) through the gray matter and into the ventral white matter to determine the locus of activation. T13 had been inserted 28 weeks earlier. Asterisks mark depths at which the evoked local field potentials became disproportionately large relative to more dorsal and ventral sites. The gray profile in the inset corresponds to the inserted nerve, and the box in the inset corresponds to the location of the micrograph in A1. The micrograph in A1 shows ChAT-labeled axons in the inserted nerve (asterisk) and in the white and gray matter (between arrows). B, Similar to A, but from another animal, 26 weeks after nerve insertion. The traces marked IZ were recorded at a depth of 900 μm beneath the pial surface 1 mm caudal and rostral, respectively, to the recordings in the upper part of B (0-1200 μm). B1 shows ChAT-labeled axons at the junction of the white and gray matter dorsolateral to the ventral horn. Calibration: A, B, 200 μV. Scale bars: A1, B1, 100 μm.
