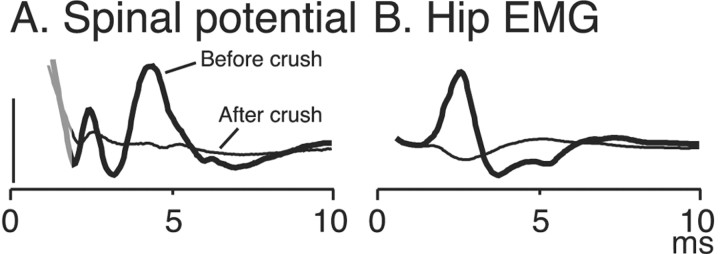
Figure 8.
Spinal surface potentials (A) and the EMG response (B) were mostly eradicated when the T13 nerve was crushed between the stimulation and insertion sites. The thick, dark traces show the responses (ensemble averages; n = 10) before crushing, and the thin, light traces, after crushing. The residual potentials could be mediated by surviving axons. The gray portion of the trace in A corresponds to the end of the stimulus artifact. Calibration: A, 200 μV.

