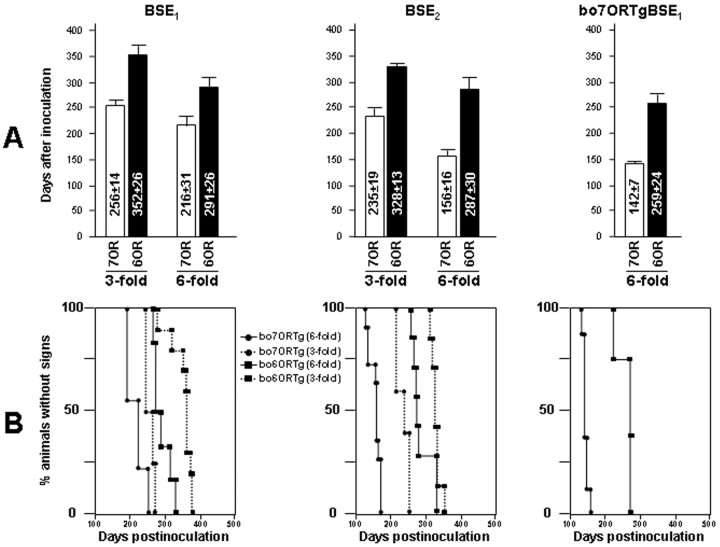
Figure 2.
Onset of clinical signs after inoculating BSE in different bovine transgenic mice. In the columns (A) or Kaplan-Meier curves (B), incubation times are compared among bo6ORTg and bo7ORTg lines (showing threefold or sixfold the PrPC levels detected in bovine brain homogenates) inoculated with BSE1, BSE2, and first passage BSE1 in bo7ORTg (bo7ORTgBSE1). Values are expressed as days after inoculation ± SD.

