
Figure 6.
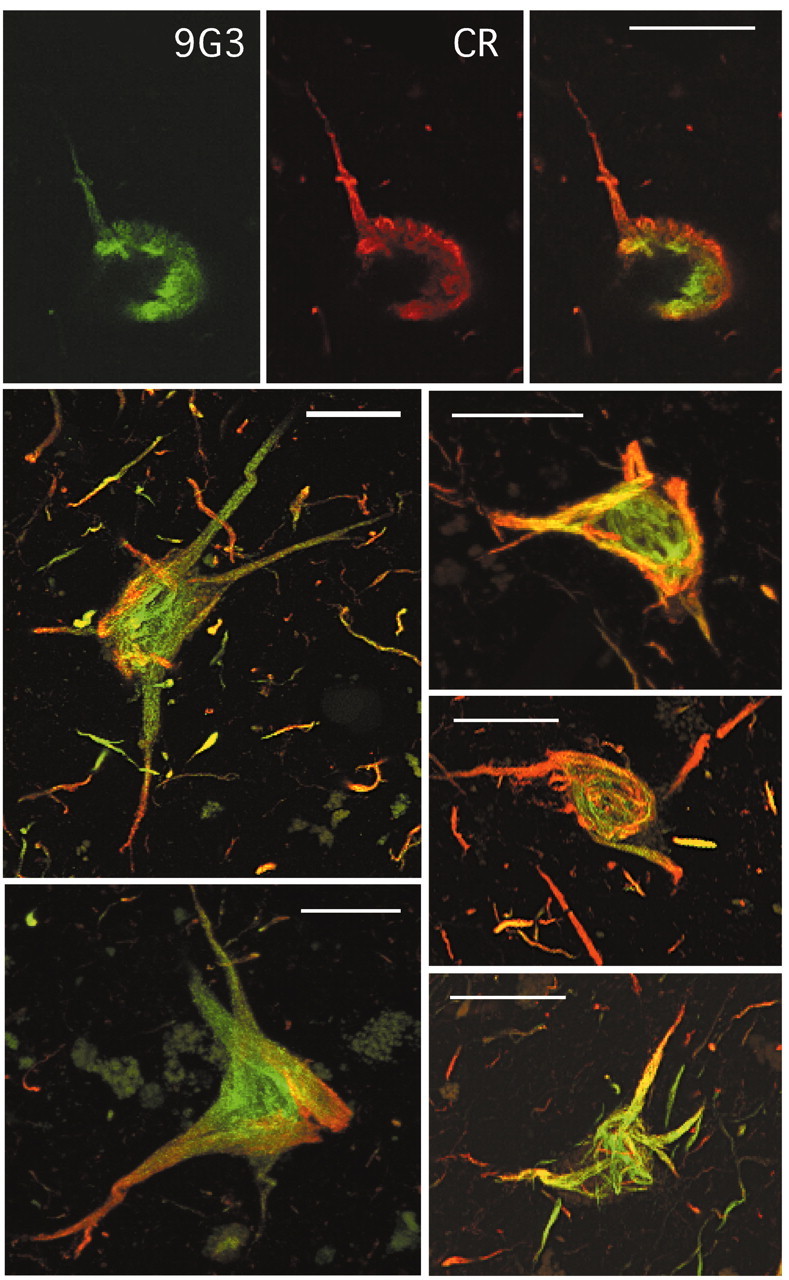
Degenerating neurons from the entorhinal cortex of AD brain. Top row shows a single optical section of a degenerating hippocampal neuron double labeled with CR and 9G3 and visualized by double immunofluorescence confocal microscopy. CR labeling was detected by Texas Red and 9G3 by Alexa 488 (see Materials and Methods) with the rightmost panel showing the merged images. Panels below show the merged projections for five neurons. The projections were created from series of 24-32 serial sections collected at either 1 or 1.5 μm steps. Scale bars, 20 μm.