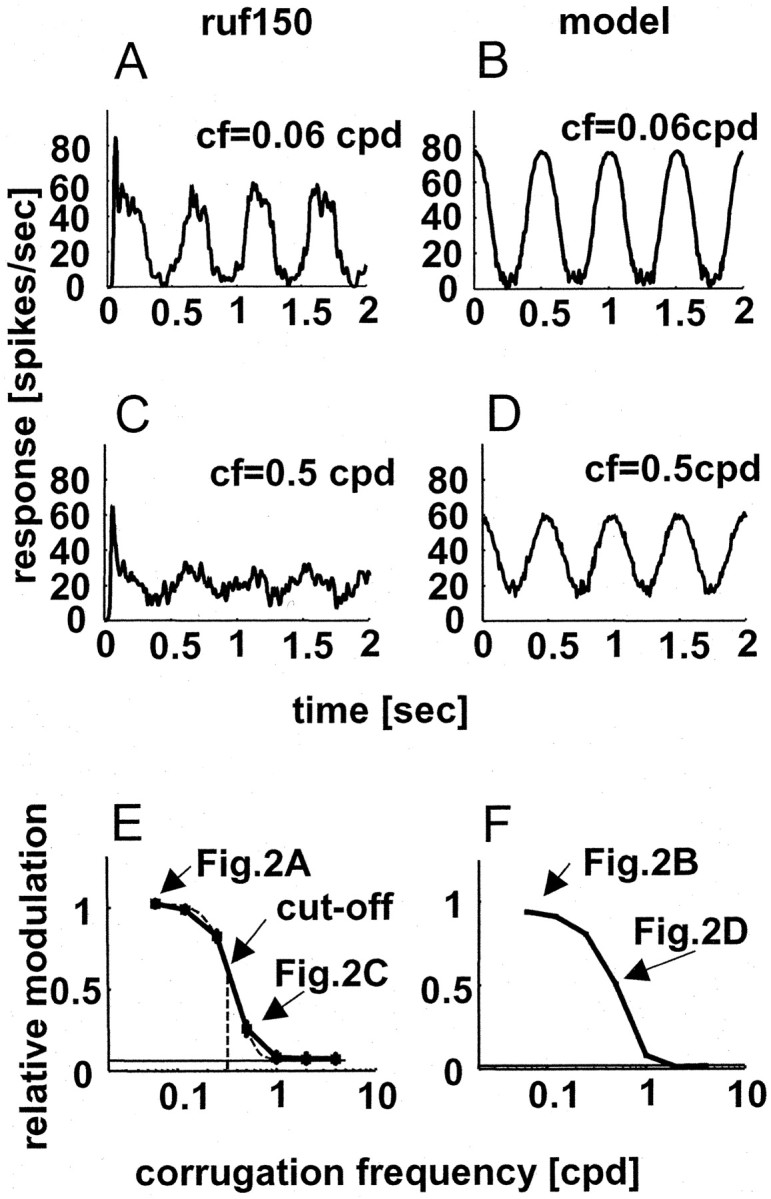
Figure 2.

Responses of a typical neuron (A, C, E) and the energy model (B, D, F) to sinusoidal corrugations in depth. A and B show spike density functions for the response to a corrugation frequency of 0.06 cpd. C and D show responses to a corrugation frequency of 0.5 cpd. The temporal frequency was always 2 Hz. In E and F, RM is plotted as a function of the corrugation frequency. The arrows indicate the RM calculated for the data shown in A-D and the high corrugation frequency cutoff (0.32 cpd) obtained for cell ruf150 (the corrugation frequency at which the modulation falls to two-thirds of the peak). The baseline in E corresponds to the RM value in response to the planar control stimulus (no modulation).
