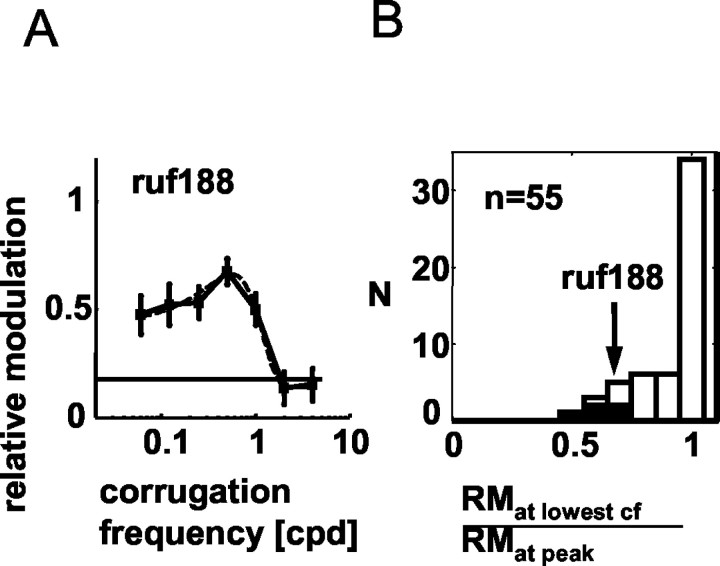
Figure 3.
Response attenuation at low frequencies was unusual. A shows RM as a function of corrugation frequency for one neuron (ruf188) with unusually marked attenuation at low frequencies. The dashed line corresponds to the Gaussian curve fitted to the data. The RM for the lowest frequency tested (0.06 cpd) was only 70% of that at the peak of the fit. This ratio, (RM at the lowest frequency tested)/(RM at peak), was used to estimate the extent of low-frequency attenuation for the population of 55 neurons (frequency histogram shown in B). The black bars correspond to the ratios of cells with statistically significant attenuation at low frequency.

