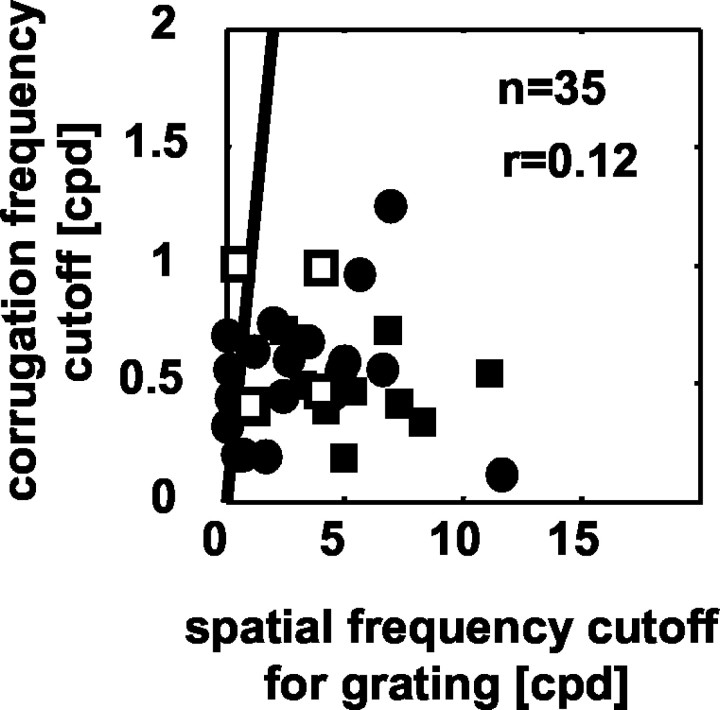
Figure 5.
Comparison of high corrugation frequency cutoff values in response to corrugations (ordinate) and high spatial frequency cutoff to sinusoidal luminance gratings (abscissa). The filled symbols show data for 35 neurons, obtained monocularly for the dominant eye (circles; n = 20) or binocularly (squares; n = 15). The solid line depicts the identity. There is no significant correlation between the two properties of the neurons (r = 0.12; NS; n = 35). Open squares represent values obtained from the model using four different RFs. This illustrates that the model does not require a correlation between corrugation and spatial frequency cutoffs for these two stimuli.

