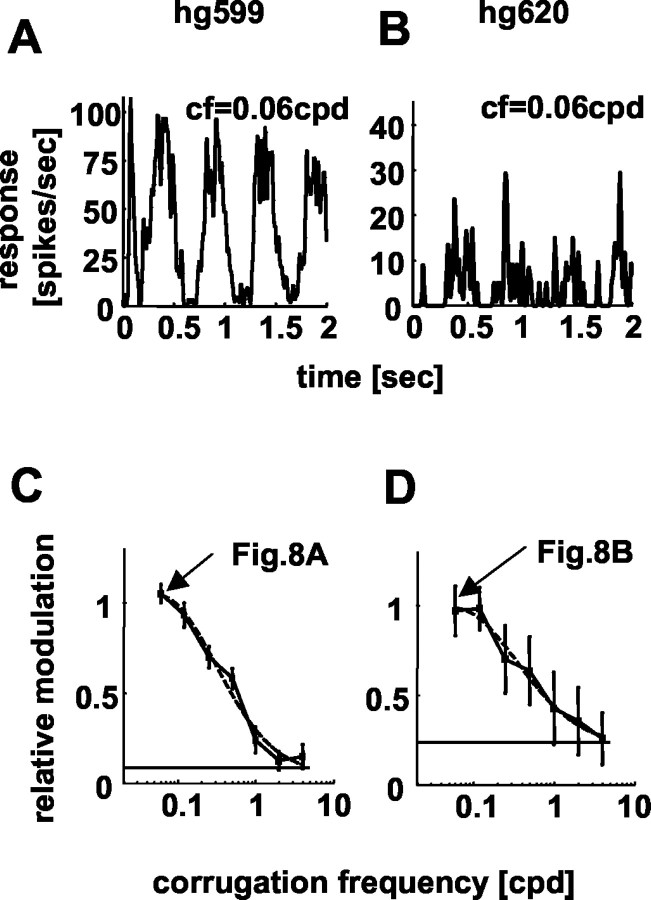
Figure 8.
Relative modulation and mean firing rate. A and B show spike density functions for two neurons, with very different mean firing rates (46 spikes/sec and 8 spikes/sec, respectively). The corrugation frequency of the disparity corrugation was 0.06 cpd, and the temporal frequency was 2 Hz. Although the values of RM are similar for both neurons (C, D), the modulation is much clearer for the neuron with the higher firing rate (A). Neurons with lower firings rates give less reliable estimates of RM. This is most clearly seen from the error bars in (C, D), which show SDs of the resampled populations.

