
Figure 6.
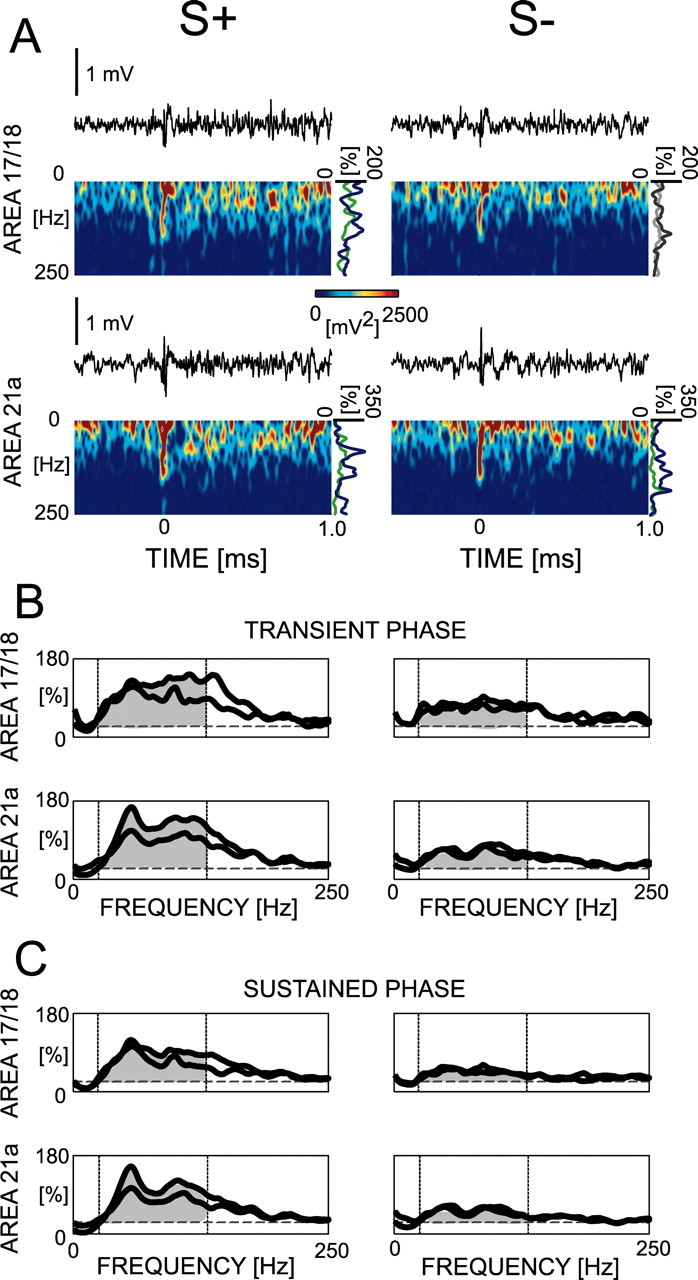
Computation of modulation curves for the power of the local field potential during passive viewing. The modulation curves are computed on single trials for the transient and sustained phases (A). Examples of such curves are presented (A, right-hand side of the spectrograms) in which part of the raw traces of two simultaneously recorded sites (one in each area) are shown for single S+ and S- trials with their respective spectrogram. The modulation curves are averaged for all of the trials to represent each recorded site. Examples of representative curves of four simultaneously recorded sites are shown for the transient (B) and sustained (C) phases. The dashed lines correspond to the 20 and 130 Hz limits used for averaging in the population statistics (Table 1). Two of these sites correspond to the same sites as in A.