
Figure 9.
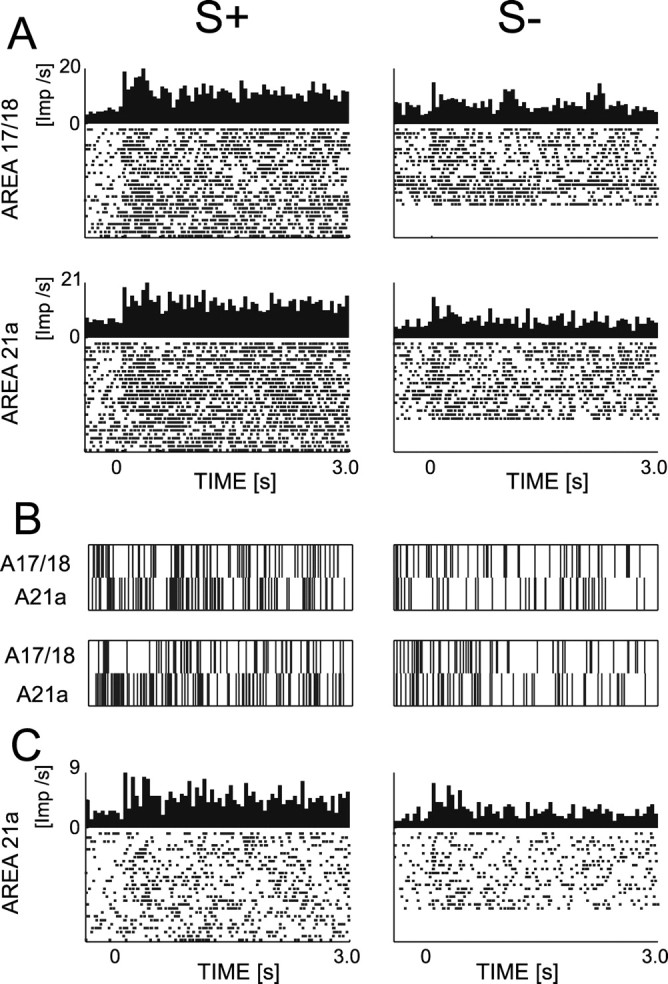
Spiking activity of multiunit and isolated unit during passive viewing. The peristimulus time histogram and raster plot of two simultaneously recorded multiunit sites are shown in A. Two single trials from these sites are shown for their simultaneous spikes in B. Even if the site in area 17/18 suggests a higher firing rate for S+ compared with S-, this effect is not observed in the population statistics (Table 1). However, such an effect is observed in area 21a during the sustained phase as shown for both the multiunit site (A) and its isolated unit (C).