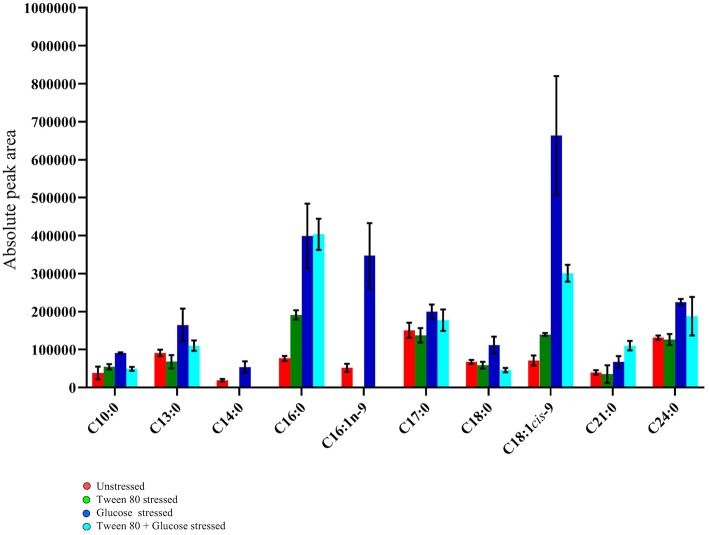
Figure 6.
GC-MS fatty acid composition analysis of the unstressed control (red), Tween 80 stressed (green), glucose stressed (blue), and Tween 80 & glucose stressed (light blue) L. plantarum B21. Each bar plot represents mean ± the standard deviation of the mean absolute peak areas from three independent experiments.

