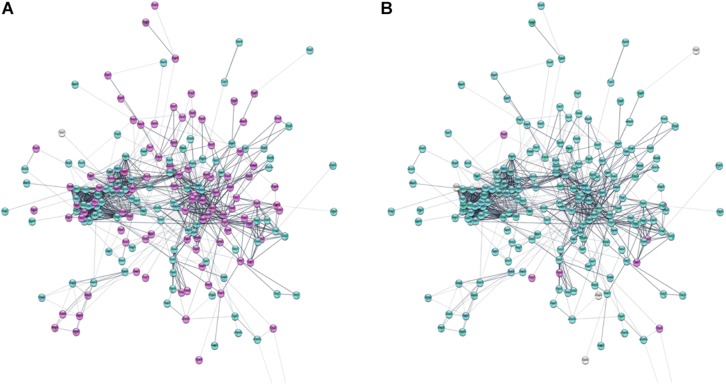
FIGURE 10.
Protein–protein interaction network of differentially expressed genes involved in neuron migration. (A) Log2 fold change of gene expression in hNPC/shWWOX vs. hNPC/shScrambled. (B) Log2 fold change of gene expression in neurons/shWWOX vs. neurons/shScrambled. Significantly upregulated genes are magenta; significantly downregulated genes are turquoise (Log2 fold change > ±1, p < 0.05). High resolution figure with legible gene names available in Supplementary Figures S4, S5.

