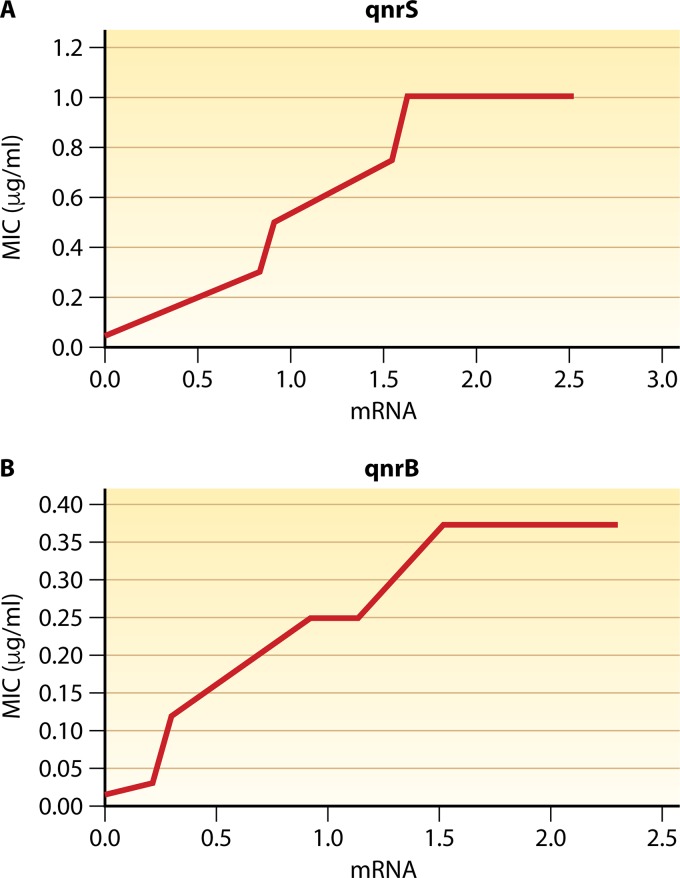
FIG 4.
Effect of expression levels of qnrS and qnrB on final MICs. In both panels, the mRNA levels are relative to those of the control genes hcaT, idnT, and cysG and are expressed in log10 units (based on data from reference 236). (A) qnrS; (B) qnrB.

