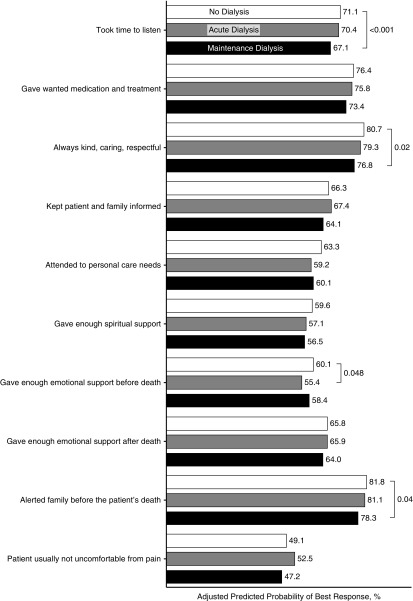
Figure 4.
Association of dialysis treatment status with most favorable response on individual bereaved family survey items. Presented are predicted probabilities of giving most favorable response versus all others; reference group is no dialysis; model is adjusted for race, age, sex, next of kin, region, facility complexity, year of death, individual comorbidities, weighted for survey nonresponse and missing items imputed; standard errors adjusted for facility-level clustering. n=5435.

