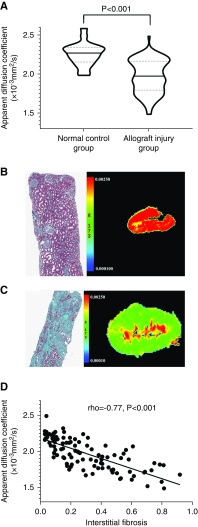
Figure 1.
Assessment of kidney allograft interstitial fibrosis with diffusion-weighted imaging. (A) Violin plot demonstrating that apparent diffusion coefficient in the normal control group is significantly higher than in the allograft injury group. The solid line represents the median, and the dotted lines represent the 25% and 75% IQR. (B and C) Representative examples of water molecular movement restriction with increasingly severe interstitial fibrosis. (B) The allograft hue turns from deep red in a normal allograft (Masson) to (C) green in a dysfunctional allograft with severe (>50%) interstitial fibrosis (Masson). (D) Cortical apparent diffusion coefficients were inversely correlated with interstitial fibrosis (rho=−0.77; P<0.001) in patients with allograft injury. Original magnification, ×100 in (B) and (C).

