Figure 3.
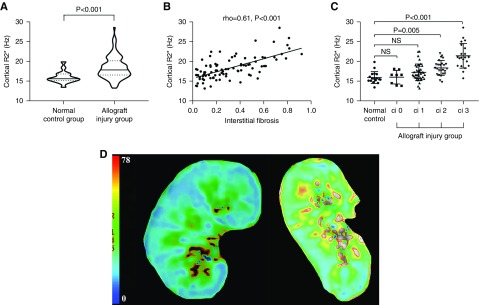
BOLD imaging evaluation of normal allografts and patients with allograft injury. (A) Violin plot demonstrating that the median cortical R2* is significantly higher in the allograft injury group than in the normal control group. The solid line represent the median, whereas the dotted lines represented the 25% and 75% IQR. (B) Cortical R2* was correlated significantly with interstitial fibrosis in patients with allograft injury (rho=0.61; P<0.001). (C) One-way ANOVA with post hoc Tukey test suggested that the mean cortical R2* was significantly higher in allografts with moderate (>25% to ≤50%) and severe (>50%) fibrosis than in normal controls. (D) Representative example of kidney hypoxia (increased R2*) in allografts with severe fibrosis (right) compared with a normal allograft (left). ci, interstitial fibrosis score.

