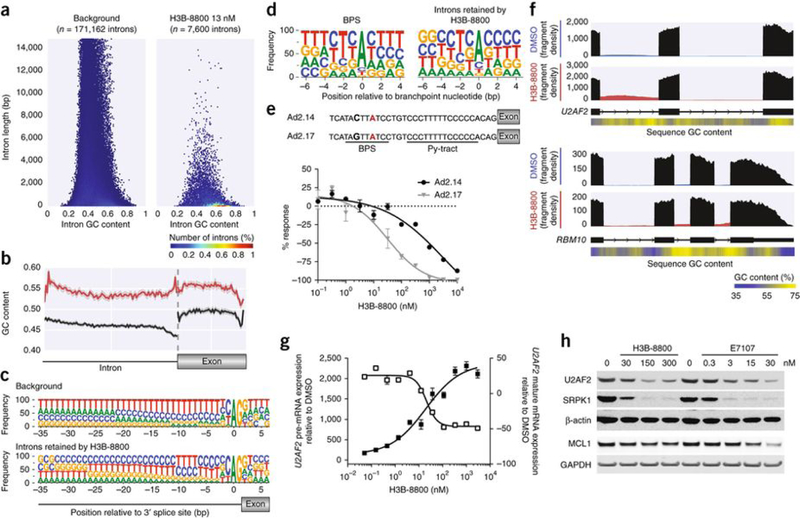
Figure 4.
H3B-8800 inhibits splicing of short, GC-rich introns and affects splicing of mRNAs encoding spliceosome components. (a) Hexbin plot showing relative abundance of introns based on length (y axis) and GC content (x axis) of all introns of expressed genes in K562 cells (background, left) versus introns retained in SF3B1K700E cells after H3B-8800 treatment (13 nM, right). The percentage of the total intron count contained within each hex is indicated by its color. (b) GC content within introns retained after H3B-8800 treatment of K562 SF3B1K700E cells (red; n = 5,788 introns) versus a randomly selected subset of introns from background (black; n = 10,000 introns). The GC content within the exons that followed is also shown. The solid line represents the mean GC content, and the shaded area surrounding the solid line represents the 95% confidence interval of that measurement. (c) The 3′ splice site motif of introns retained in K562 SF3B1K700E cells following H3B-8800 treatment as compared to background. (d) Branchpoint sequence motif (extending from 6 nt upstream of the branchpoint nucleotide to 4 nt downstream of the branchpoint) representing all branchpoints sequenced by Mercer et al.26 (left) and only those branchpoints within introns retained in in K562 SF3B1K700E cells following H3B-8800 treatment (right). (e) Top, depiction of two Ad2-derived pre-MRNA substrates: Ad2.14, in which the Py-tract contains five cytosines and five thymines, and Ad2.17, which also contains an alteration in the BPS to reduce binding affinity to U2 snRNP. The branchpoint nucleotide is labelled in red, and the nucleotide that was changed between Ad2.14 and Ad2.17 to alter branchpoint strength is bolded. Bottom, the results from in vitro splicing using these two pre-mRNA substrates. The y axis represents the percent response relative to DMSO control (0%). Data are represented as mean ± s.d.; n = 3 technical replicates. (f) Sashimi plot representing the average read density of three technical replicates in introns 3 and 4 of U2AF2 (top) and introns 20, 21, and 22 of RBM10 (below) of RNA-seq samples from K562 SF3B1K700E cells treated with DMSO or H3B-8800. Exons are shown in black, and introns are shown in blue (DMSO treated) or red (H3B-8800 treated). Relative GC content (derived using a 100-bp sliding window) is depicted in a heat map below the reference sequence. (g) The effect of an increasing concentration of H3B-8800 on the level of U2AF2 pre-mRNA (black squares) and mature mRNA (open squares) in K562 SF3B1K700E cells as quantified by qPCR. Data are represented as mean ± s.e.m.; n = 3 technical replicates. (h) Western blot analysis of U2AF2, SRPK1, and MCL1 protein levels following treatment of K562 SF3B1K700E cells with H3B-8800 or E7107 at the indicated concentrations. β-actin and GAPDH were used as loading controls.

