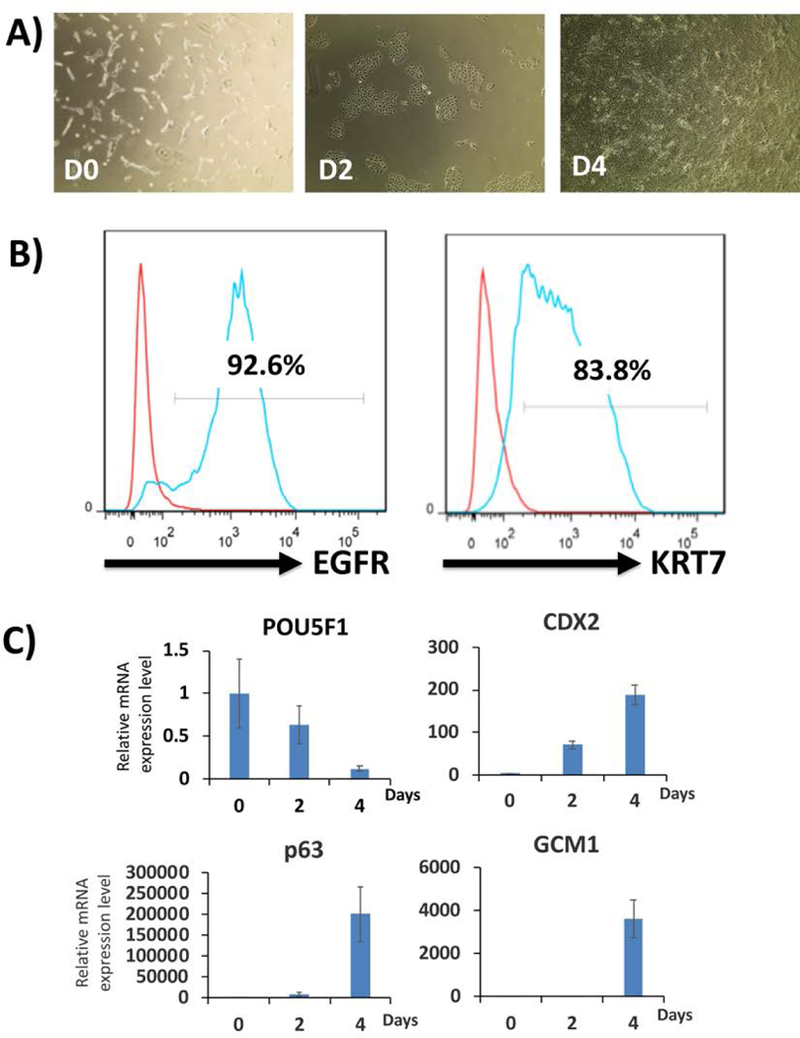
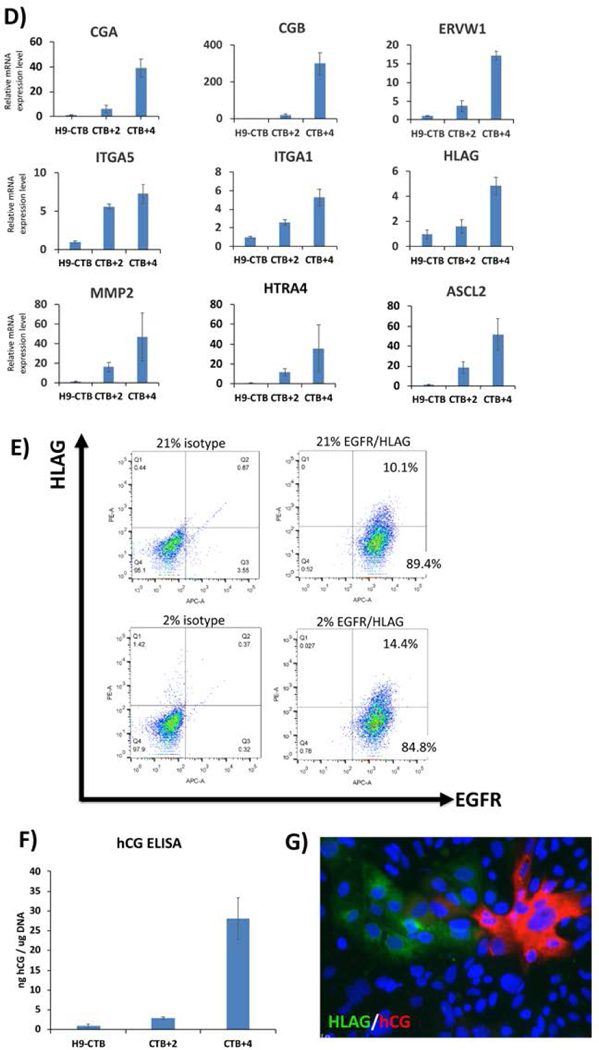
Figure 2.


Representative two-step differentiation data from StemFlex-adapted WA09/H9 hESCs.
A) Morphology of the cells during the first step of differentiation (day 0 to day 4). Cells are plated (day −1) in StemFlex media with Rock inhibitor or RevitaCell; this is why they have a spiky morphology on day 0. Once BMP4 and IWP2 are added, differentiation begins uniformly, resulting in flattened epithelial morphology throughout the entire well by day 4.
B) Flow cytometric analysis of cells at the end of the first step of differentiation (day 4) for the CTB marker, EGFR. Over 90% of cells express EGFR compare to the isotype control. These cells are also over 80% positive for pan-trophoblast marker, KRT7.
C) qPCR for lineage-specific markers during the first step of trophoblast differentiation. The pluripotency marker, POU5F1, is decreased, while CTB markers (p63, CDX2 and GCM1) are increased throughout the 4-day period. Data are normalized to 18S and expressed as fold-change above day 0 (undifferentiated state).
D) qPCR for lineage-specific markers during the second step of trophoblast differentiation. STB markers (CGA, CGB, ERVW1) and EVT markers (ITGA5, ITGA1, HLAG, MMP2, HTRA4, ASCL2) are increased throughout differentiation. Data are normalized to 18S and expressed as fold-change over H9-derived CTB (cells differentiated to day 4 of the first-step differentiation). Time points indicate 2 or 4 days post-replating (CTB+2 and CTB+4, respectively).
E) Flow cytometric analysis of cells following 3 days after second-step of differentiation (CTB+3). Note that while all cells are positive for the CTB marker, EGFR, a portion also co-express the EVT marker, HLAG. Cells differentiated under 2% oxygen showed enhanced HLAG expression compared to those differentiated under 20% oxygen.
F) hCG ELISA confirms differentiation into syncytiotrophoblast (STB)-like cells. Data are normalized to total genomic DNA from the cells in the same well from which supernatant samples were collected.
G) Cells are stained with STB marker hCG and EVT marker HLAG on day 3 following the second-step of differentiation (CTB+3). The lack of overlap between these two markers indicates that STB- and EVT-like cells co-exist in the same culture at the end of the second step.
