
Fig. 1. Simulation results.
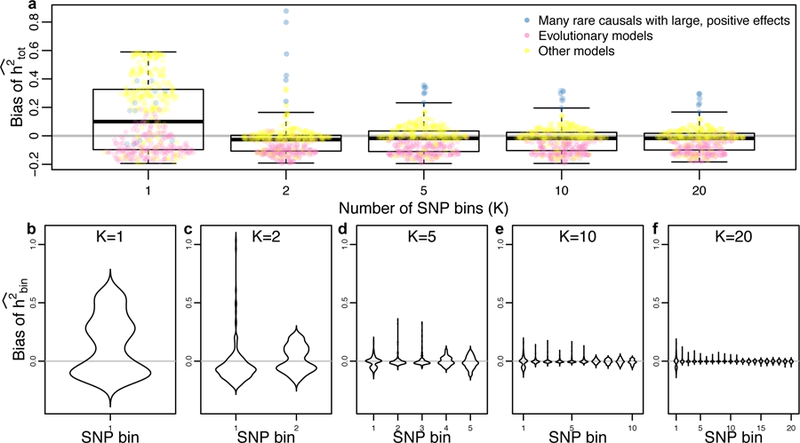
Across a broad range of parameters, the accuracy of heritability inference improves as the number of SNP bins (partitioned by MAF) increases. (a) Mean bias of total heritability (inferred-true) for different numbers of SNP bins (K), where each point represents the mean of 500 simulations for different parameters, and a box plot summarizing the bias distribution across all parameters (indicating median, upper/lower quartile, and twice the interquartile range). (b–f) The distribution of average bias across simulated parameters for each SNP bin, showing that both mean and variance of the bias decrease as K increases (n = 500 simulations in each plot).