
Figure 3. Pervasive purifying selection drives the genetic architecture of gene expression.
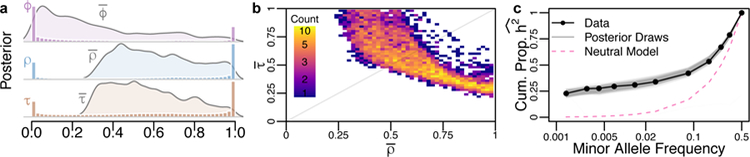
Our model infers the strength of purifying selection acting on causal variants (ϕ), the correlation between the fitness and the effect size of causal variants (ρ), and a scaling factor that transforms fitness into effect sizes (τ). (a) The posterior distribution of the mean of each parameter across genes (curves), as well as a histogram of the posterior parameter estimates for each gene. (b) The joint posterior distribution of the average ρ and τ across genes shows an evolutionary tradeoff between the correlation and scaling of fitness and effect sizes. (c) The cumulative proportion of heritability inferred from the gene expression data (dots) compared to the expected patterns from 1000 draws from the posterior distribution (grey) and neutral expectation (pink).