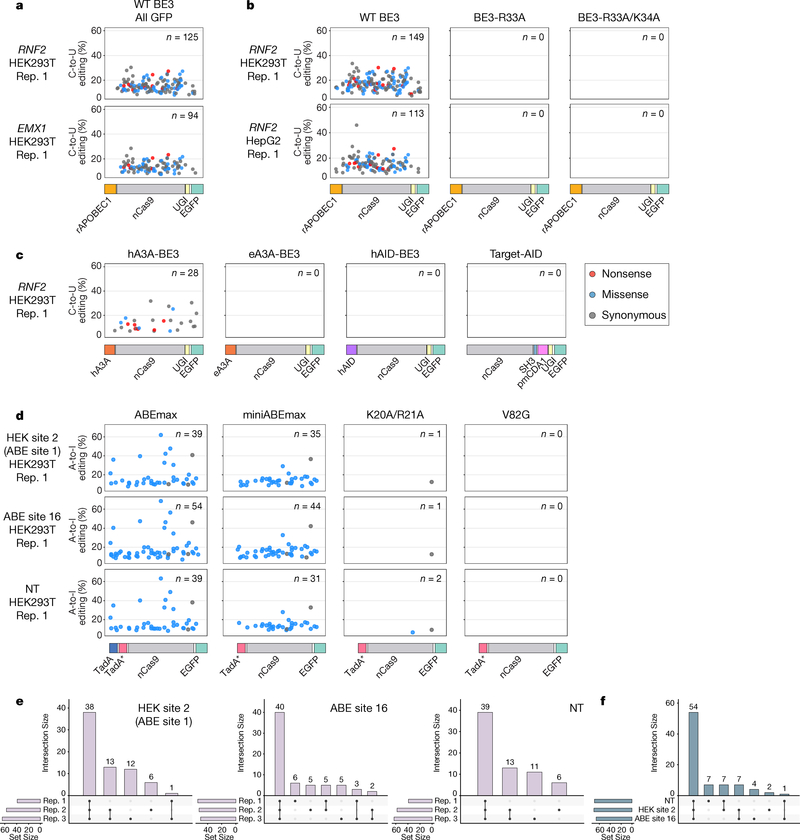
Figure 4. Self-editing generates a diverse range of heterogeneously edited CBE and ABE transcript sequences in HEK293T and HepG2 cells.
(a) Scatterplots showing C-to-U self-editing of the BE3-encoding RNA transcript observed with WT BE3 (with rAPOBEC1) expression in HEK293T cells (sorted for all GFP-positive cells) with two different gRNAs targeting sites in RNF2 and EMX1. Each dot represents an edited C and the color of the dot indicates the predicted type of mutation caused by a C-to-U edit at that position (Methods). The y-axis shows editing efficiencies for each C-to-U modification and the x-axis represents the position of each C within the BE3 coding sequence (with the architecture of the editor shown schematically below but not displaying the NLS and linkers). Data were obtained by analyzing previously published RNA-seq experiments5. n = total number of modified Cs. (b) Scatterplots illustrating C-to-U self-editing observed with wild-type (WT) BE3 (with rAPOBEC1), SECURE-BE3 (R33A) and SECURE-BE3 (R33A/K34A) in HEK293T and HepG2 cells sorted for top 5% GFP signal with co-expression of the RNF2 gRNA. Data are shown as described in a. Data were obtained by analyzing previously published RNA-seq experiments5. (c) Scatterplots depicting C-to-U self-editing observed in HEK293T cells expressing hA3A-BE3, eA3A-BE3, hAID-BE3, and Target-AID (sorted for top 5% GFP signal). Data are shown as described in a and were obtained using the RNA-seq experiments shown in Fig. 3b. (d) Scatterplots showing A-to-I self-editing induced by expression of ABEmax, miniABEmax, miniABEmax-K20A/R21A, and miniABEmax-V82G (sorted for all GFP-positive cells) with gRNAs targeting HEK site 2, ABE site 16, and a non-targeting gRNA (NT) in HEK293T cells. Data are shown as described in a and were obtained using the RNA-seq experiments shown in Figs. 1c and 1d. n = total number of modified As. (e) UpSet plots showing the intersections of RNA A-to-I self-edits induced by ABEmax on its own transcript across three replicates (data from Fig. 4d and Supplementary Fig. 6d). Each plot shows data from co-expression of ABEmax with one of three different gRNAs. (f) UpSet plots showing the intersection of RNA A-to-I self-edits induced by ABEmax across three different gRNAs using the data shown in Fig. 4d and Supplementary Fig. 6d. For each gRNA, we used A-to-I edits that represent the union of all such edits across the three replicates.

