
Figure 3.
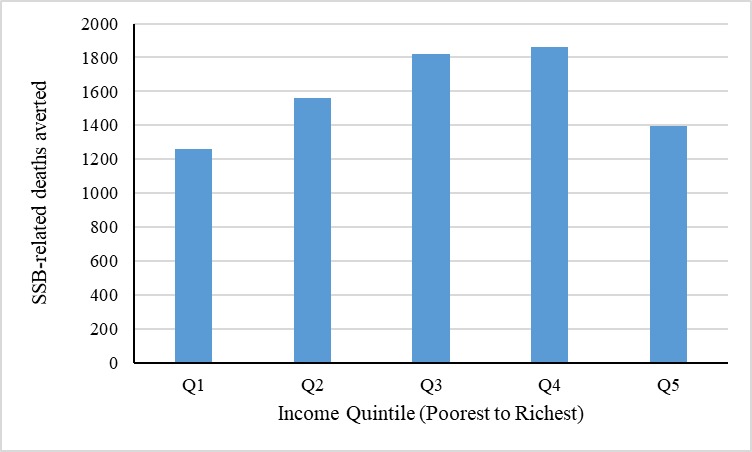
Estimated distribution of potential type 2 diabetes mellitus (T2DM)-related deaths averted over a 20-year time period, with a 10% tax on sugar-sweetened beverage (SSB) prices. This figure shows the distribution across income quintiles of potential T2DM-related deaths averted due to a 10% tax on SSB prices over a 20-year time period in South Africa. Q1 refers to lowest income quintile, Q5 refers to highest income quintile.