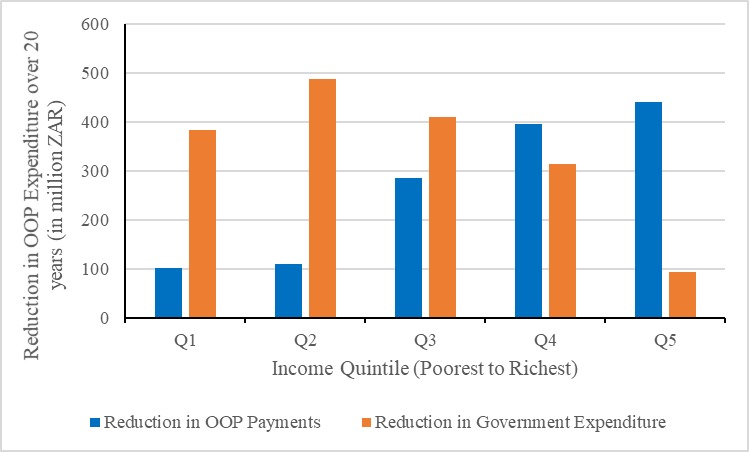
Figure 4.

Estimated distribution of the reduction of out-of-pocket (OOP) payments and government expenditures related to type 2 diabetes mellitus (T2DM) healthcare costs by income quintile, in South Africa, over a 20-year time period. This figure shows the distribution across income quintiles of reductions in OOP expenditures and government expenditures on subsidies that are related to T2DM healthcare costs due to 10% tax on sugar-sweetened beverages over a 20-year time period in South Africa. Q1 refers to lowest income quintile, Q5 refers to highest income quintile. ZAR, South African rand.
