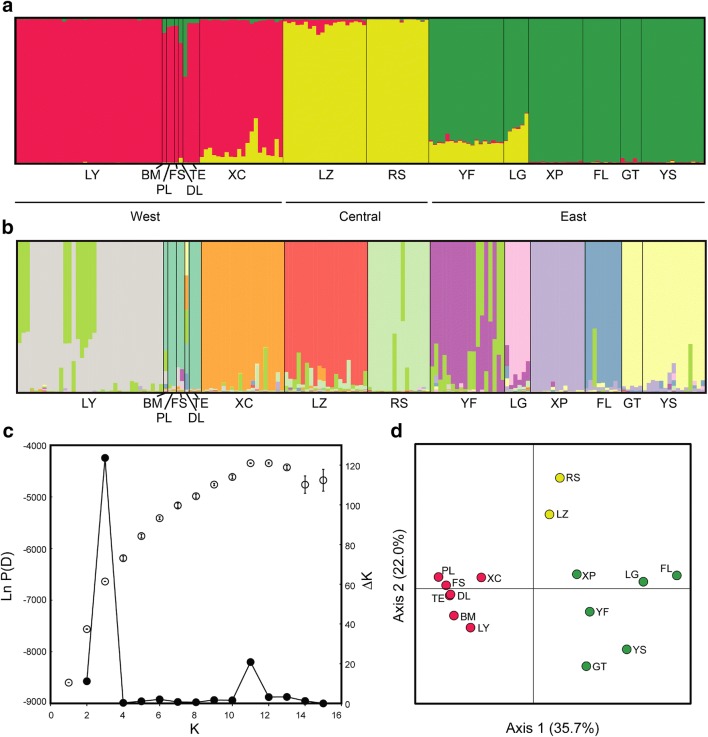
Fig. 3.
The results of STRUCTURE & PCoA. a STRCTURE bar plot representing K = 3 of the Bayesian assignment of 165 individuals from 15 populations of Begonia luzhaiensis based on genetic variation of 16 EST-SSR loci. Each vertical bar represents an individual plant is represented by a single vertical line grouped by populations. b STRCTURE bar plot representing K = 11. c The ΔK plot shows that K = 3 is the highest ΔK value. d PCoA analysis is based on EST-SSR loci using GENALEX

