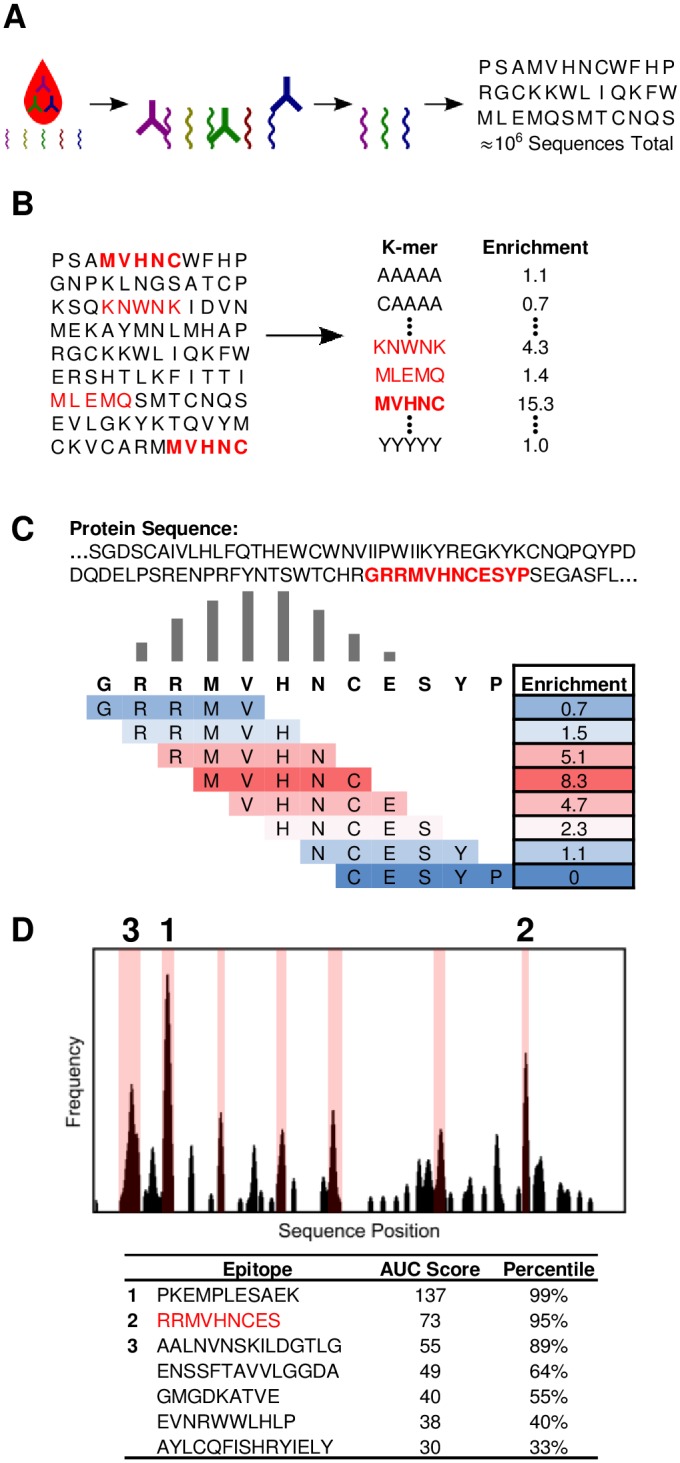
Fig 1. K-TOPE determines epitopes by tiling proteins into k-mers.

(A) The input to the algorithm is a dataset of approximately 106 peptides that were bound by serum antibodies. (B) All 5-mers are evaluated for their enrichment in the list of peptides. (C) A portion of a protein sequence is tiled into 5-mers which are weighted by their enrichment. This determines a “frequency” value for each position in the sequence. (D) The frequency value for each position in a protein sequence is plotted as a histogram. Possible epitopes are highlighted in pink on the graph. Epitope sequences, area under the curve (AUC) scores, and significance percentiles are displayed.
