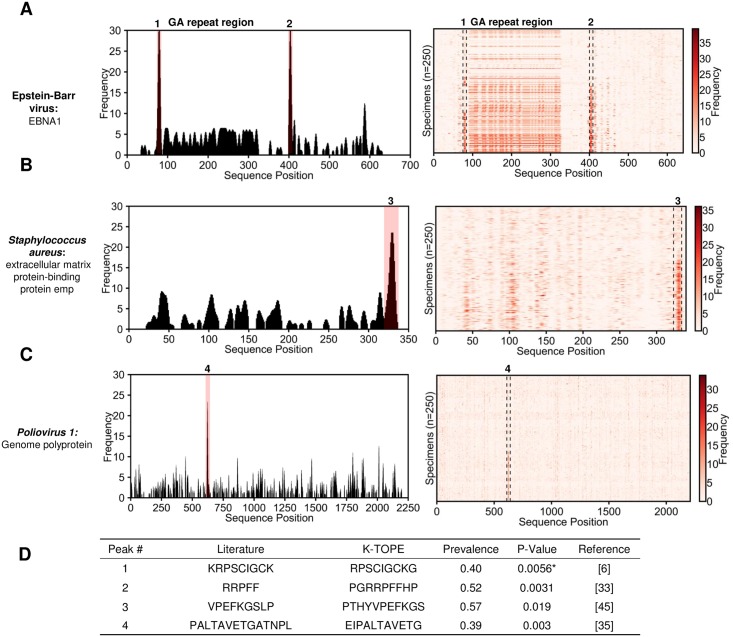
Fig 4. Epitopes predicted through proteome searches were validated using literature-reported epitopes.
In (A), (B), and (C), histograms are shown for typical individual specimens (epitopes with percentiles > 99.7% are highlighted in pink). To the right of the histogram is a heat map for 250 specimens. For (A), there is a region of antigenic GA-repeats from positions 100–350. The table in (D) provides the statistical significance of agreement between literature epitopes and K-TOPE epitopes for the labeled peaks in (A), (B), and (C). The UniProt accessions used for this analysis were P03211 for EBNA1, Q8NXI8 for extracellular matrix protein-binding protein emp, and P03300 for Poliovirus 1 Genome Polyprotein. Statistical tests where epitopes with >50% GA content were removed are denoted by an asterisk “*”. All predicted epitopes had p-values below 0.05.

