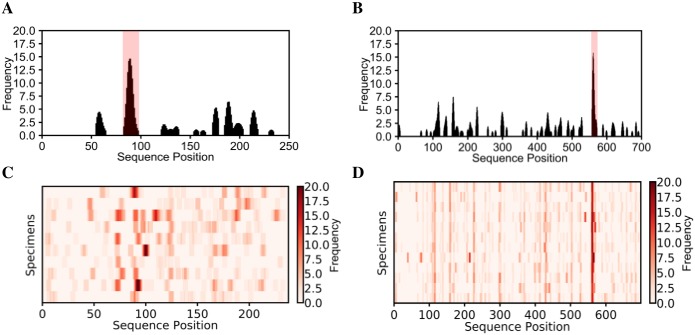
Fig 5. K-TOPE predicted epitopes for glycoprotein G1 using HSV1 specimens and for glycoprotein G2 using HSV2 specimens.
For glycoprotein G1, a representative histogram for a single specimen is shown in (A) and a heat map for all HSV1 specimens is shown in (C). For glycoprotein G2, a representative histogram for a single specimen is shown in (B) and a heat map for all HSV2 specimens is shown in (D). There was a single epitope predicted for each protein. Epitopes with percentiles > 97% are highlighted in pink.

