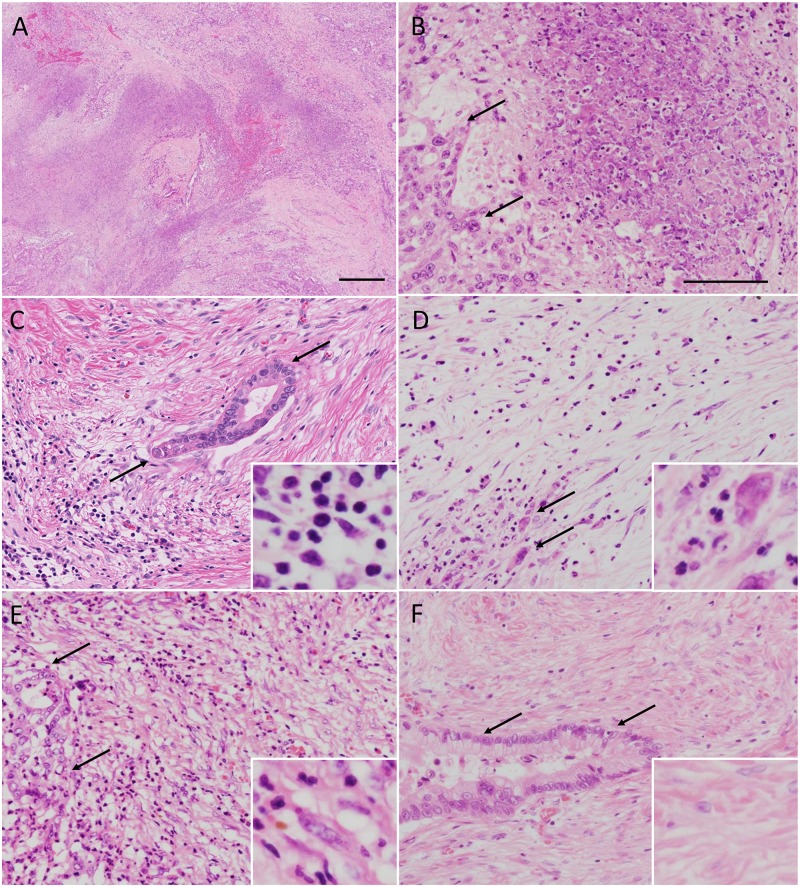
Fig 1. Histologic changes in pancreatic cancer patients following neoadjuvant therapy.
(A) Appearance of necrosis in the areas affected by cancer. (B) Higher magnification of a region from panel (A). Arrows mark viable cancer cells. Images showing lymphoplasmacytic and neutrophilic infiltration of the stroma (C and D, respectively). Examples of immature and mature fibrosis are shown in panels (E) and (F), respectively. Arrows indicate cancer cells. All tissue specimens were stained with hematoxylin and eosin staining solution. Bars, A, 500 μm; B-F, 100 μm.

