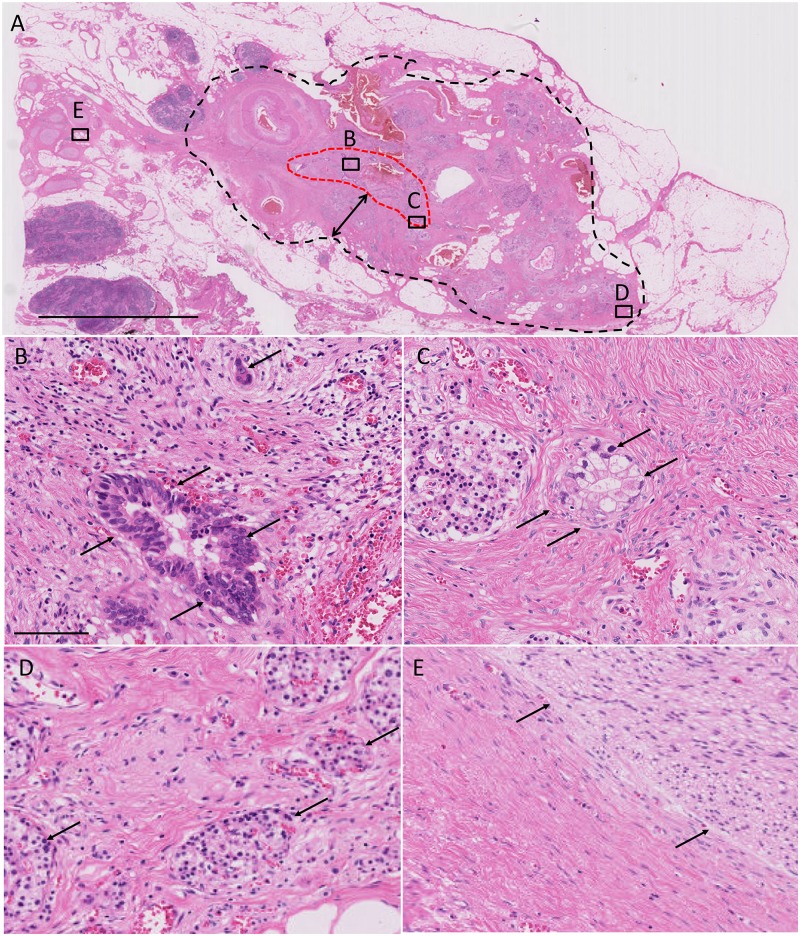
Fig 2. Encapsulating fibrosis following neoadjuvant therapy.
(A) Red and black dotted lines represent cancer remnants and encapsulating fibrosis area, respectively. Double-headed arrow marks a fibrous area of 2 mm thickness. Panels (B-E) show the higher magnification images of the selected areas (black squares) in (A). Arrows show cancer cells (B and C), islets (D), and nerve plexus in panels (E), respectively. All specimens were stained with hematoxylin and eosin solution. Bars, A, 6 mm; B-E, 100 μm.

