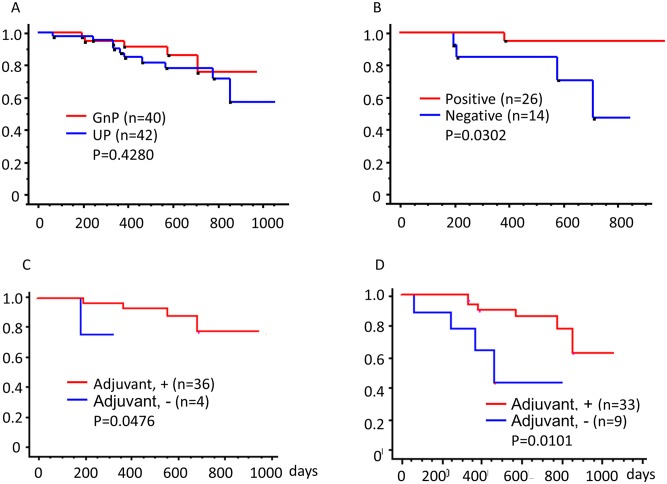
Fig 4. Overall survival of patients receiving neoadjuvant therapy.
Kaplan-Meier survival analysis of 82 patients included in this study. (A) Red and blue curves represent patients receiving neoadjuvant therapy (gemcitabine combined with nab-paclitaxel, GnP group; n = 40) and those who underwent upfront surgery (UP group; n = 42), respectively. P = 0.4280. (B) Red and blue curves represent patients with encapsulating fibrosis (n = 26) and those without it (n = 14), respectively. P = 0.0302. (C) Red and blue curves represent patients receiving adjuvant therapy (S1, GnP, or Gem; n = 36) and patients without adjuvant therapy (n = 4), respectively in the GnP group. P = 0.0476. (D) Red and blue curves represent patients receiving adjuvant therapy (S1, GnP, or Gem; n = 33) and patients without adjuvant therapy (n = 9), respectively in the UP group. P = 0.0101.

