
Fig 2. Percentage of mutated IgM+ FO-B cells and MZ-B cells within different IGHV gene families.
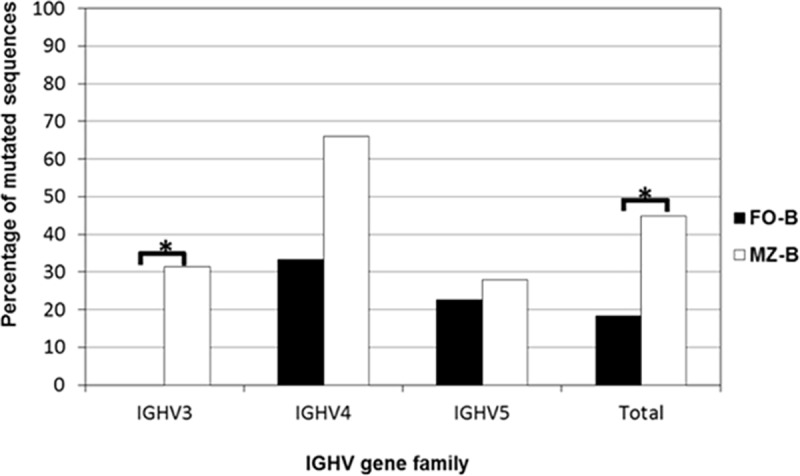
Analysis of the proportion of mutated sequences (>2 mutations compared to the closest germline gene) shows that MZ-B cells express more mutated sequences than FO-B cells, when all sequences from the three IGHV gene families are combined (i.e. “total”) (Fisher’s exact test: P < 0.001). This difference between MZ-B cells and FO-B cells was largely due to a significant difference in the percentage of mutated sequences within the IGHV3 family (Fisher’s exact test: P = 0.016). There are relatively more mutated sequences found in the IGHV4 gene family compared to IGHV3 and IGHV5 both for the MZ-B cells (Fisher’s exact test: P < 0.001) and FO-B cells (Fisher’s exact test: P = 0.023).