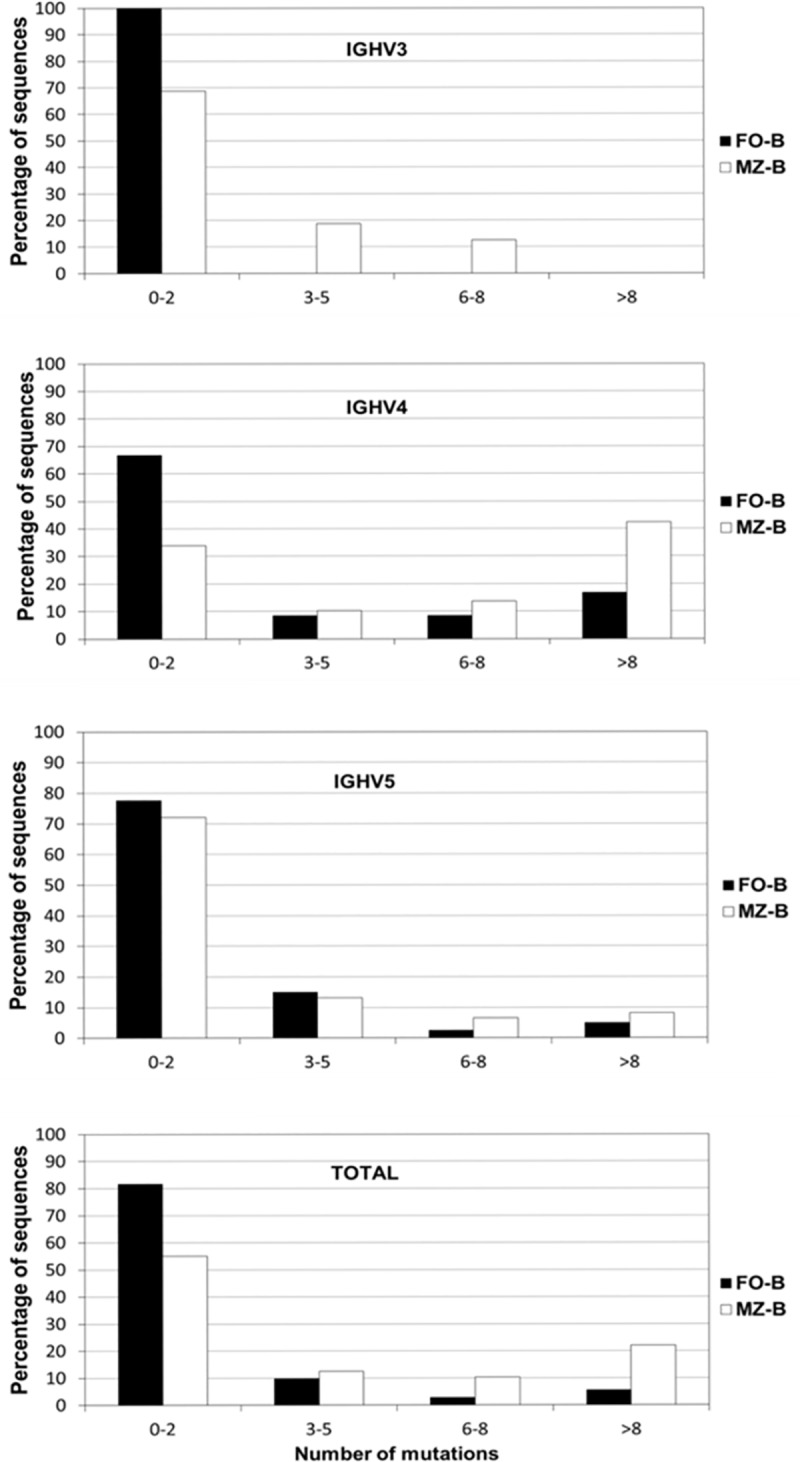
Fig 3. Mutation frequency of IGHV-Cμ transcripts of different IGHV families within MZ-B cells and FO-B cells.

Analysis of the distribution of the number of mutations of all (“total”) IGH-Cμ transcripts shows that MZ-B cells have significantly more mutations per transcript than FO-B cells (Mann-Whitney P = 0.046). Within the MZ-B cell subset, IGHV4 sequences contained more mutations than in IGHV3 or IGHV5 sequences (Kruskal-Wallis, P = 0.011).
