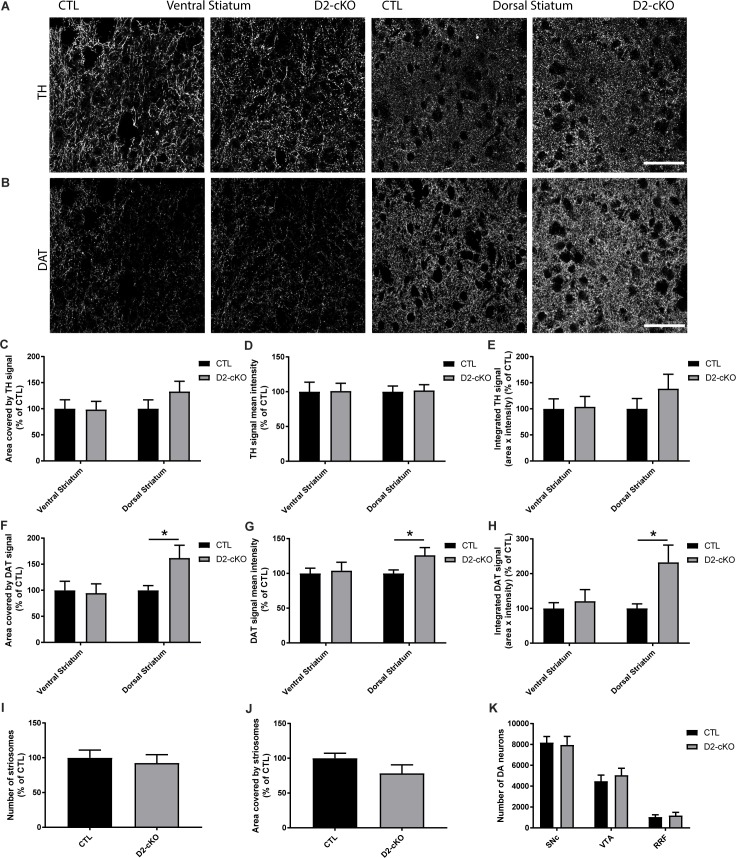
Fig 2. Increase in DAT but not TH striatal expression in D2-cKO mice, without a change in the number of DA neurons.
TH (A) and DAT (B) immunofluorescence levels were measured in the ventral and dorsal striatum in controls and D2-cKO mice. Scale bar = 50 μm. % area covered (C,F), mean signal intensity (D,G) and integrated signal (E,H) were quantified for TH and DAT signals as well as the number of striosomes (I) and their size (J) using DAT signal. N = 15–22 brains/group, mean ± SEM, *p>0.05. The number of DA neurons in the SNc, VTA and RRF (K) was measured using stereological counting. N = 4–5 brains/group, mean ± SEM.

