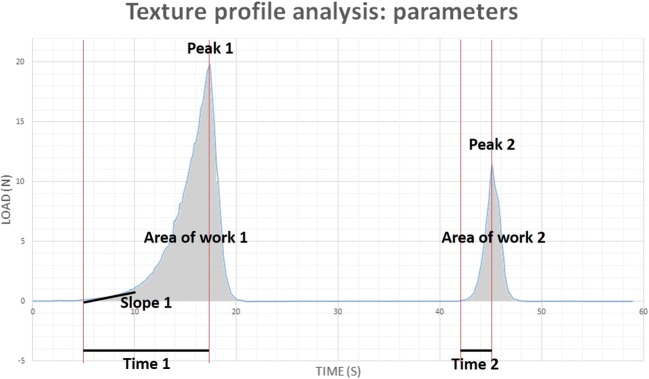
Fig. 1.
Texture profile analysis parameters. Stiffness = slope of the toe region (0.1–1 N) of the curve (slope 1). Hardness 1 and 2 = peak force during the first and second cycle respectively (peaks 1 and 2). Cohesiveness = the ratio of the work of the second cycle to that of the first cycle (area of work 2 divided by area of work 1). Springiness = the division of the distance of the detected height on the second cycle by the original compression time (Fig. 1: time 2 divided by time 1)

