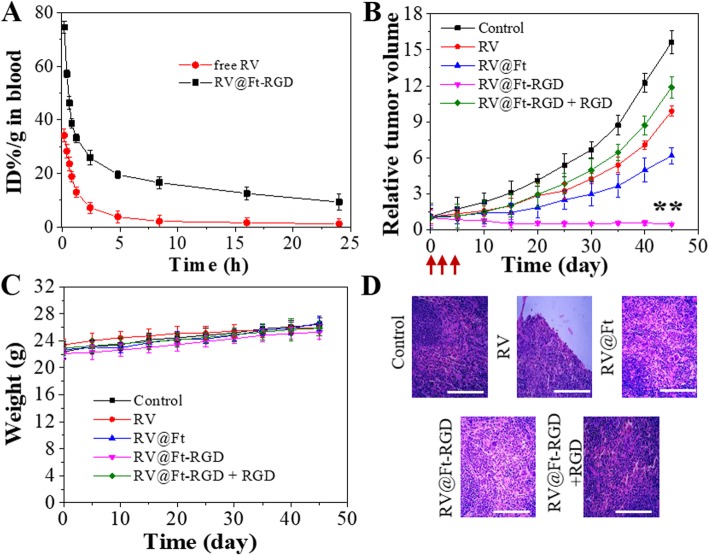
Fig. 7.
a Circulation time of free RV and RV@Ft-RGD in blood. b The growth profile of A549 xenografted tumors after three-time intravenous injection of saline (control), RV, RV@Ft, RV@Ft-RGD + RGD, and RV@Ft-RGD. Red arrow indicates the injection time point. **P < 0.01, compared with other groups, respectively. c Body weight of tumor-bearing mice after various treatments. d Micrographs of H&E-stained tumor slices collected from different groups of mice after the end of the treatment. Scale bars are 50 μm

