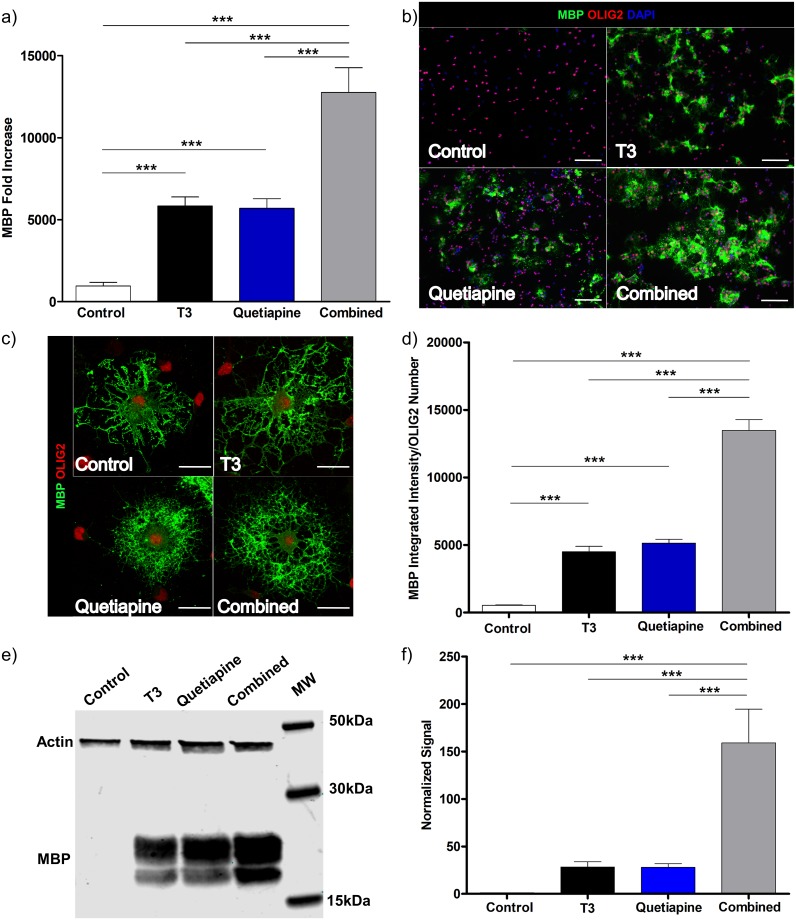
Fig 1. Quetiapine induces differentiation of OPC and has an additive effect on T3 induced differentiation.
OPCs isolated from 4–7 days old rats were cultured for 96 hrs under PDGF 20ng/ml, were then induced to differentiate in OPC media with the addition of T3 45nM (Black), Quetiapine 1μM (Blue), or both (Grey) for 96 hrs. OPC media with 0.1%DMSO (vehicle) was used as control (White). (a) MBP expression was measured by qPCR. A pre-treatment day 0 sample was used to normalize gene results. Error bars represent standard error of the mean from 3 independent isolations and experiments. One-way ANOVA analysis with Tukey’s multiple comparison analysis was run (p **<0.001, *** p< 0.0001). (b) Immunocytochemistry: Plated cells were fixed with 4% PFA, stained for MBP (Green), Olig2 (Red) and DAPI (Blue). Representative images at 20X, for Control (upper left), T3 (upper right), Quetiapine (lower left), T3 plus Quetiapine (lower right), scale bar 100μm. (c) Laser scanning confocal microscopy images 63X of Control (upper left), T3 (upper right), Quetiapine (lower left), T3 plus Quetiapine (lower right), scale bar 20 μm. (d) A ratio was determined between MBP intensity quantification and OLIG2 positive cell number, the bar graph represents the results from 6 different experiments and the error bars are the standard error of the mean. One-way ANOVA analysis with Tukey’s multiple comparison analysis was run (*** p< 0.0001). (d) Protein lysate from OPC culture was obtained after 4 days of treatment with the conditions mentioned before, and western blot was performed, (e) representative image and (f) quantification results from 6 different experiments, one-way ANOVA analysis with Tukey’s multiple comparison analysis was run (*** p< 0.0001).

