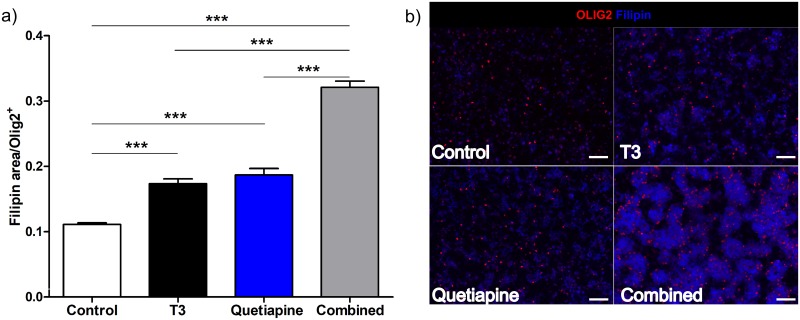
Fig 4. T3 and Quetiapine induce cholesterol production.
OPCs isolated from 4–7 days old rats and cultured for 96 hrs under PDGF 20ng/ml, were then induced to differentiate in OPC media with the addition of T3 45nM (Black), Quetiapine 1μM (Blue), or both (Grey) for 96 hrs. OPC media with 0.1%DMSO (vehicle) was used as control (White). (a) Cells were fixed with 4% PFA then stained for Olig2 and Filipin. A ratio between filipin stained area and OLIG2 positive cell number was determined, the bar graph represents the results from 6 different experiments and the error bars are the standard error of the mean. One-way ANOVA analysis with Tukey’s multiple comparison analysis was run (*** p< 0.0001). (b) Representative images at 20X, for Control (upper left), T3 (upper right), Quetiapine (lower left), T3 plus Quetiapine (lower right), scale bar 200μm.

