. 2019 Aug 22;8:e43582. doi: 10.7554/eLife.43582

Figure 1. vih1 vih2 loss-of-function mutants show severe growth phenotypes and hyperaccumulate Pi.

(A) Schematic overview of VIH1 and VIH2: (upper panel) VIH1 and VIH2 genes with exons described as rectangles, introns as lines. T-DNA insertions are depicted as triangles, primer positions used in qRT-PCR analyses are indicated by arrows. (lower panel) VIH1 and VIH2 protein architecture, with kinase domains shown in black, phosphatase domains in gray and putative linkers/unstructured regions as lines. The point mutations used in this study are shown below the domain schemes. (B) qRT-PCR expression analysis of VIH1 and VIH2 transcripts in the T-DNA mutant allele backgrounds. Shown are 2-∆CT values relative to Col-0 wild-type. Quantifications were done using three biological replicates. (C) Growth phenotypes of vih1 and vih2 single mutant, and of vih1 vih2 double mutants. Shown are plants 20 DAG in soil compared to Col-0 wild-type. (D) Growth phenotypes of vih1-2 vih2-4, vih1-2, vih2-4, and of ipk1-1 compared to Col-0 wild-type seedlings. Plants were germinated in vertical 1/2MS plates for 8 d, transferred to Pi-deficient 1/2MS plates supplemented with either 0 mM, 1 mM or 10 mM Pi and grown for additional 6 d. Scale bars correspond to 2 cm. (E) Trend analysis of seedling root length vs. cellular Pi concentration for the seedlings described in (D). For each boxed position, root length measurements were performed for seedlings from three independent MS plates. (F) Pi contents of the seedlings shown in (D) 14 DAG. For each boxed position, four independent plants were measured with two technical replicates. (G) qRT-PCR quantification of PSI marker genes (PPsPase1, PECP1, MGD3, MGD2, SPX1, SPX3, PAP22, PAP5, ACP5, IPS1, PHT1;4) and of the non-PSI genes PHR1 and LPR1 in Col-0 wild-type, vih1-2 vih2-4, vih1-2, vih2-4 and ipk1-1 seedlings described in (D). Expression levels are represented as Z-scores. The original data are shown in Supplementary file 3a.

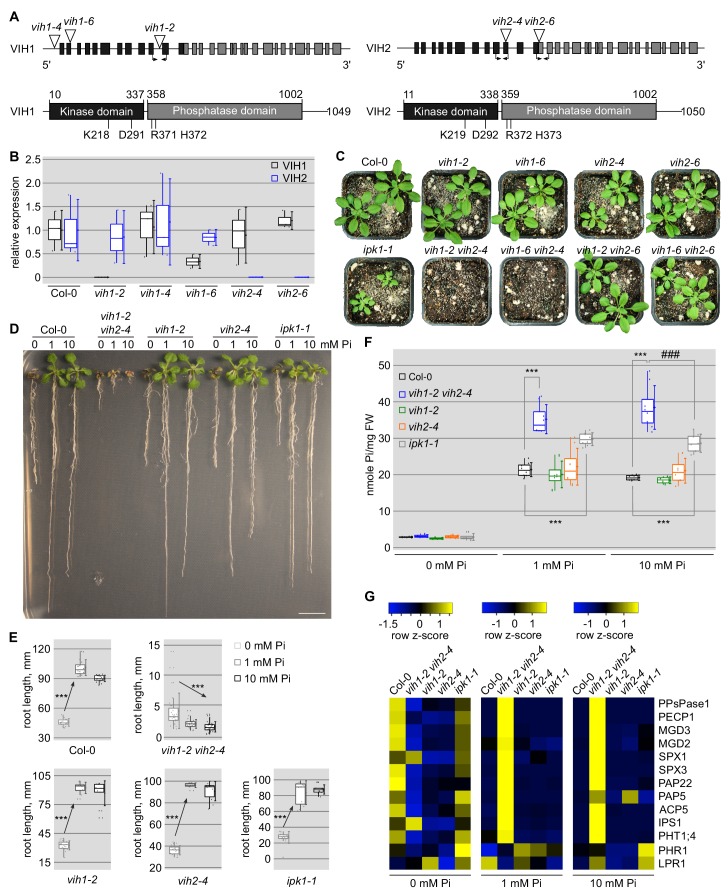
Figure 1.

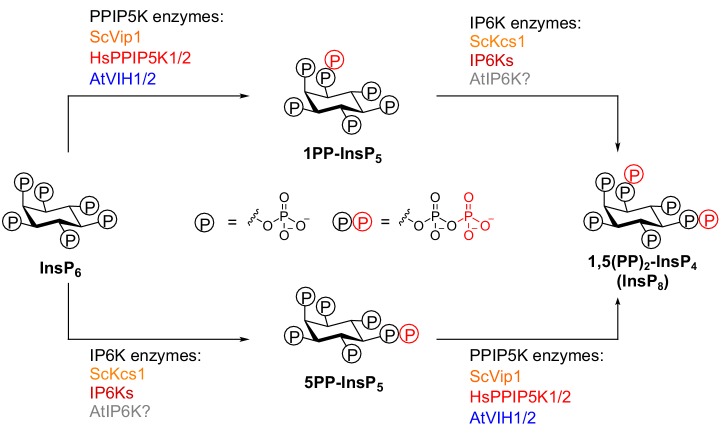
Figure 1—figure supplement 1. Overview of PP-InsP isoforms and kinases involved in inositol pyrophosphate metabolism.

Figure 1—figure supplement 1.

Two classes of inositol pyrophosphate kinases, PPIP5K and IP6K, are responsible for the synthesis of inositol pyrophosphates. The scheme outlines PPIP5K enzymes from Saccharomyces cerevisiae ScVip1, Homo sapiens HsPPIP5K11 and 2, and Arabidopsis thaliana VIH1 and VIH2. These enzymes synthesize 1PP-InsP5 and 1,5(PP)2-InsP4 (InsP8) by phosphorylating InsP6and 5PP-InsP5 at the C1 position, respectively. IP6K enzymes from Saccharomyces cerevisiae KCS1 and Homo sapiens IP6Ks synthesize 5PP-InsP5 and 1,5(PP)2-InsP4 (InsP8) by phosphorylating InsP6and1PP-InsP5 at the C5 position, respectively. Plant IP6Ks have not been reported thus far.

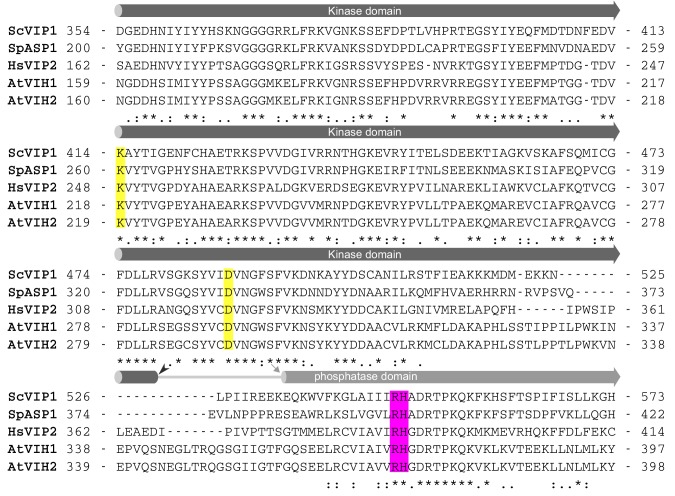
Figure 1—figure supplement 2. The kinase domain and phosphatase domain of VIHs/PPIP5Ks are conserved among different species.

Figure 1—figure supplement 2.

Structure-based sequence alignment of the kinase - phosphatase cores of Saccharomyces cerevisiae Vip1 (Uniprot (https://www.uniprot.org/) identifier: Q06685), Schizosaccharomyces pombe ASP1 (Uniprot identifier: O74429), Homo sapiens PPIP5K22 (Uniprot identifier: O43314), Arabidopsis thaliana VIH1 (Uniprot identifier: Q84WW3), and VIH2 (Uniprot identifier: F4J8C6). Predicted kinase domain and the N-termini of the phosphatase domains in VIHs/PPIP5Ks are shown as dark and light gray cylinders, respectively. Linker regions are indicated by gray lines. Conserved residues that were mutated in this study are highlighted in yellow for the kinase domain and in magenta for the phosphatase domain.

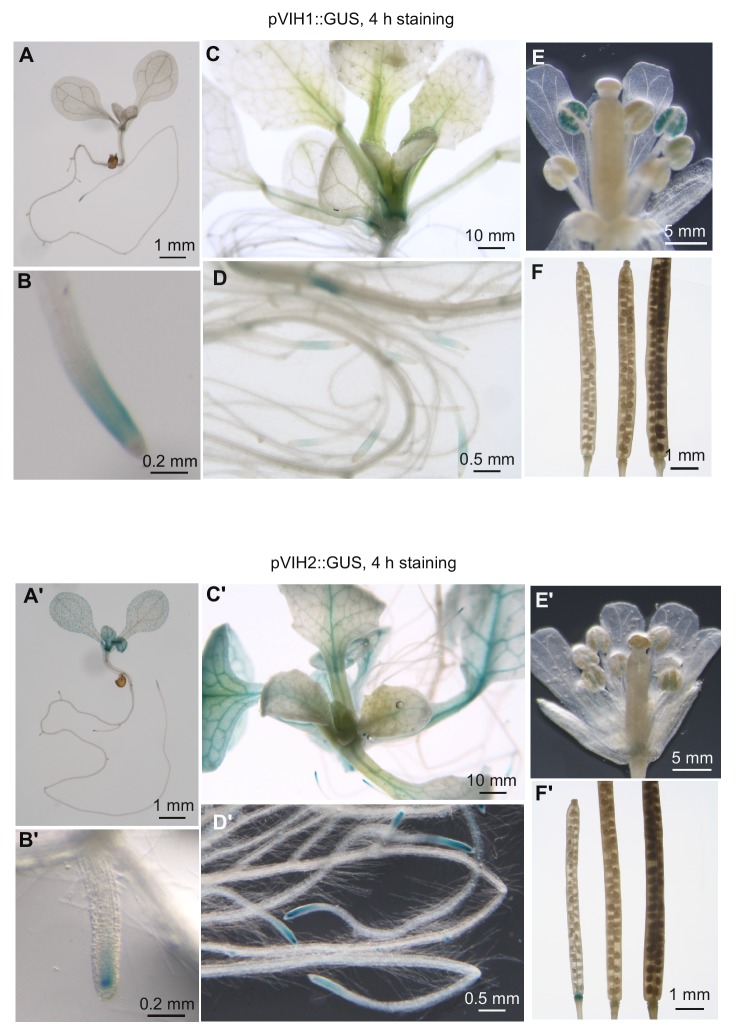
Figure 1—figure supplement 3. VIH1 and VIH2 show partly unique and partially overlapping expression patterns.

Figure 1—figure supplement 3.

Transgenic Arabidopsis lines expressing pVIH1::GUS and pVIH2::GUS in the Col-0 wild-type background were stained for 4 hr and analyzed for β-glucuronidase activity. Images were acquired from seedlings 7 DAG (A,B and A’,B’) and 14 DAG (C,D and C’,D’), flowers (E and E’) and siliques (F and F’).

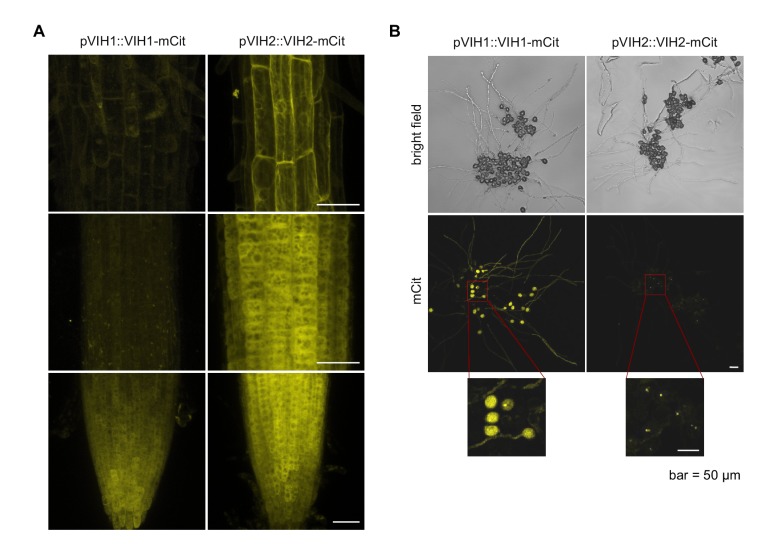
Figure 1—figure supplement 4. VIH1 and VIH2 are cytoplasmic enzymes with partially overlapping expression domains.

Figure 1—figure supplement 4.

Stacked slices of (A) confocal scanning microscopy images showing the root tip of transgenic Arabidopsis plants expressing pVIH1::VIH1-mCit (left) and pVIH2::VIH2-mCit (right) in the vih1-2 and vih2-4 background, respectively. (B) Confocal scanning microscopy images of pollen and pollen tubes from the plants shown in (A), incubated for 4 hr on agarose plates containing 5 mM CaCl2, 5 mM KCl, 1 mM MgSO4, 0.01% (w/v) H3BO4 and 10% (w/v) sucrose, and 1.5% (w/v) agarose pH 7.5. Similar localization and expression patterns were observed in at least three independent transgenic lines. Scale bars = 50 μm.

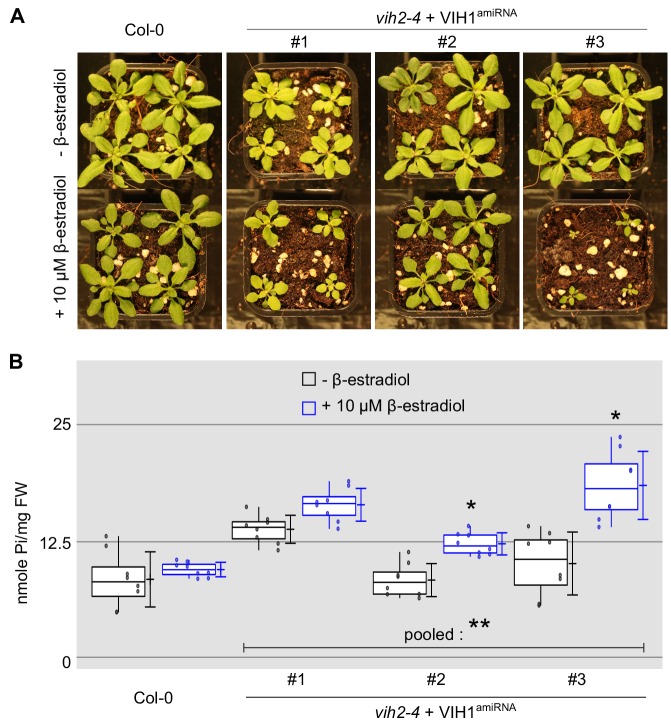
Figure 1—figure supplement 5. Inducible knock-down of VIH1 in the vih2-4 background impairs plant growth and leads to shoot Pi accumulation.

Figure 1—figure supplement 5.

(A) Growth phenotypes of Col-0 wild-type and inducible mutant lines. Seedlings 7 DAG were transferred to soil and sprayed daily with tap water containing either 10 μM β-estradiol diluted from a 100 mM stock solution (100% [v/v] ethanol), or the corresponding concentration of ethanol only. (B) Shoot Pi content of plants 20 DAG treated or not with 10 μM β-estradiol as described in (A). For each boxed position, four independent plants were measured using two technical replicates.